Comprehensive Guide to Statistics Formulas and Concepts for TI-83/84 Calculators
This guide provides essential formulas and definitions for various statistical concepts as utilized in TI-83/84 calculators. It covers key metrics including sample mean, median, sample standard deviation, population mean, interquartile range, quartiles, and z-scores. The document also details the binomial probability formula, outlining the calculations for success probabilities within a specified number of trials. Each statistic is clearly defined with corresponding formulas to facilitate understanding and application. Perfect for students and professionals needing quick access to statistical tools.

Comprehensive Guide to Statistics Formulas and Concepts for TI-83/84 Calculators
E N D
Presentation Transcript
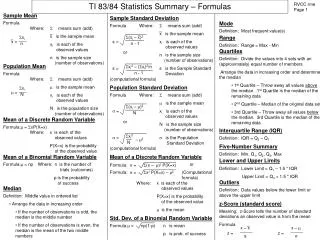
TI 83/84 Statistics Summary – Formulas RVCC rme Page 1 Sxi n x = Where: S means sum (add) x is the sample mean xi is each of the observed values n is the sample size (number of observations) Where: S means sum (add) x is the sample mean xi is each of the observed values n is the sample size (number of observations) s is the Sample Standard Deviation Median • Definition: Middle value in ordered list • Arrange the data in increasing order • If the number of observations is odd, the median is the middle number • If the number of observations is even, the median is the mean of the two middle numbers Population Mean Formula Where: S means sum (add) m is the sample mean xi is each of the observed values N is the population size (number of observations) Sxi N m = Interquartile Range (IQR) Definition: IQR = Q3 – Q1 x – m s x – x s Mode Five-Number Summary z = z = s = Sxi2 N – m2 Definition: Most frequent value(s) Definition: Min, Q1, Q2, Q3, Max Sample Standard Deviation Lower and Upper Limits S(xi – x)2 n - 1 Quartiles Formula Definition: Lower Limit = Q1 – 1.5 * IQR Upper Limit = Q3 + 1.5 * IQR Definition: Divide the values into 4 sets with an (approximately) equal number of members s = Outliers • Arrange the data in increasing order and determine the median • 1st Quartile – Throw away all values above the median. 1st Quartile is the median of the remaining data • 2nd Quartile – Median of the original data set • 3rd Quartile – Throw away all values below the median. 3rd Quartile is the median of the remaining data Sxi2 – (Sxi)2/n n - 1 Definition: Data values below the lower limit or above the upper limit or z-Score (standard score) s = Meaning: z-Score tells the number of standard deviations an observed value is from the mean (computational formula) Formula Range Formula:m = np(1-p) Definition: Range = Max - Min Sample Mean Formula Population Standard Deviation Formula Where: S means sum (add) m is the sample mean xi is each of the observed values N is the sample size (number of observations) s is the Population Standard Deviation S(xi – m)2 N s = Mean of a Discrete Random Variable or Formula:m = SxP(X=x) Where: x is each of the observed values P(X=x) is the probability of the observed value (computational formula) Mean of a Binomial Random Variable Mean of a Discrete Random Variable Formula: s = S(x –m)2P(X=x) Formula:m = np Where: n is the number of trials (outcomes) p is the probability of success or Formula: s = Sx2P(X=x) – m2 (Computational formula) Where: x is each of the observed values P(X=x) is the probability of the observed value m is the mean Std. Dev. of a Binomial Random Variable n is mean p is prob. of success
TI 83/84 Statistics Summary – Formulas RVCC rme Page 2 P(X = x) = ( ) px (1-p)n-x nx ( ) = n n! x x!(n-x)! x – m s/ n t = Factorial Studentized Version of Sample Means (t-Score) k! = k. (k-1). (k-2)…. 3. 2. 1 Binomial Coefficient Where: x is the sample mean m is the population mean s is the sample standard deviation n is the sample size df (degrees of freedom) = n - 1 Where: x is the number of successes (between 0 & n) n is the number of trials (n – x) is the number of failures Binomial Probability Formula Where: P(X=x) is the probability of x successes x is the number of successes (between 0 & n) n is the number of trials (n – x) is the number of failures p is the probability of success of a single trial (1 – p) is the probability of failure of a single trial