Download
1 / 22
220 likes | 385 Vues
The Distance Ladder. Topics Trigonometric Parallax; Spectroscopic Parallax; Cepheid variables; Standard Candles Type Ia Supernovae …and others. Motivation Learn how we measure the size of the Universe. See how other quantities depend upon the Universe’s size. The Distance Ladder.

E N D
The Distance Ladder • Topics Trigonometric Parallax; Spectroscopic Parallax; Cepheid variables; Standard Candles Type Ia Supernovae …and others • Motivation Learn how we measure the size of the Universe. See how other quantities depend upon the Universe’s size.
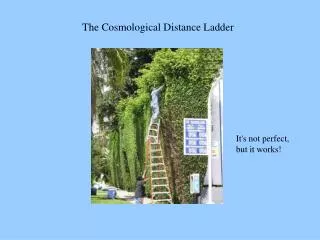
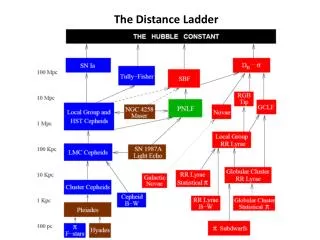
The Distance Ladder • How does one determine the distances to cosmic objects? • Distance is not directly measureable; it must be inferred. • This is one of the greatest challenges in observational astronomy. • The philosophy is to measure the distances to close objects using the most reliable methods, then use those results to calibrate following methods to further objects: repeat, repeat, repeat. • This construction is called the Distance Ladder. It becomes so rickety, that ultimately the distances of very distant objects may be uncertain by a factor of two or more.
A Factor of Two Ex: if something is 2× further away than we thought…. Its luminosity is 4× greater than we thought. Its size is 2× greater than we thought. Its volume is 8× greater than we thought. Its mass (ρ×V) is 8× greater than we thought. If it is an energy source using fuel (mass) at a certain rate (luminosity), our estimate for its lifespan (mass/luminosity) would be off by 8×/4× = 2×. • 3
Radar Ranging: Solar System Radar signals are sent to the moon, or to inner planets. The time delay for the return determines the distance. Common frequencies include 8495 MHz, 8510 MHz (λ~3.5 cm). The trip to the Moon and back takes 2.56 sec. An astronomical unit is therefore determined by this method to be 149,597,871 km (500 sec; 8 min 20 sec). Radar ranging cannot be reliably used for the sun. (The sun is soft!) • 4
Parallax: Nearest Stars Objects appear to shift back and forth, depending upon your viewing distance. Closer objects shift back and forth more. • 5
Trigonometric Parallax: Nearest Stars This effect can be used to measure distances. As the Earth moves in its orbit, stars shift back and forth in the sky. EXAMPLETwo viewers, separated by 1 astronomical unit, are observing an object 3.26 LY away. Their measures of the object’s direction differ by 1 arc second. By definition, the distance to a star is: D=3.26 LY/(parallax angle) = 1 parsec/ (parallax angle). • 6
Pre-1989, only a hundred or stars had accurate parallax measures. ESA’s Hipparcos satellite (1989-1993) measured parallax angles with very high precision (0.002 arc sec) for over 100,000 stars (to about 1600 light-years). ESA’s Gaia mission (2013) will be able to measure parallax angles of 2×10⁻⁵ arc seconds (5×10⁴ pc), for 109 stars! It is currently in a calibration stage. • Trigonometric Parallax: Nearest Stars • 7
Consider the Hertzsprung-Russell Diagram. Different stars have different luminosities. Even within a spectral class, there are different luminosity classes: dwarfs, subgiants, giants, supergiants. Luminosity class can be determined by details of spectra (line widths). Therefore, by determining a star’s spectral type and luminosity class, we can determine its actual brightness. …Then, we look at how bright the stars look in the sky…. • Spectroscopic Parallax: Stars • 8
Spectroscopic Parallax: Stars Example: Consider the three stars below, which all have the same apparent brightness. Suppose Star 1 is a main sequence O star. Suppose Star 2 is a main sequence G star. Suppose Star 3 is a main sequence M star. What is the order, from closest to farthest? If Star 1 is 106 times more luminous than Star 2, how many times further away is it? • 2 • 1 • 3 • 9
Cluster Fitting: Distant Stars Star clusters are exceptional laboratories for studying stars because all the stars in a cluster share the same characteristics: Age Composition Reddening/dimming from interstellar dust Distance An HR diagram made of only the stars in a cluster is called a cluster diagram. The distance of the cluster can be inferred by the direction the cluster data are shifted on the cluster diagram. • 10
So what do we have so far? Radar ranging → astronomical unit measurement. Trigonometric parallax → an understanding of stellar characteristics. Spectroscopic parallax → information on other types of stars. Cluster fitting → Distances to clusters… …and since we know the distances to clusters, we know the distances to all the objects in them. This lets us search clusters for yet other objects that might be good measures for distance. • 11
Pressure-Gravity Balance Stars are in a state of balance, where the (inward) force of gravity is balanced by the (outward) force produced by pressure differences—the deeper into a star you go, the higher the pressure. If a star collapsed inwards upon itself (for fictional reasons), it would convert gravitational collapse energy into heat energy. The thermal pressure would increase, and the star would re-expand to its original condition. • By the same mechanism, if a star expanded, it would cool, and recollapse to its original configuration. • 12
Temperature-sensitive opacity For stars of a specific combination of temperatures and pressures, an interesting effect can occur. As the star collapses and gets hotter, some of the energy goes into ionizing helium atoms (each helium atom loses an electron). He+→He++ + e- This ionized helium is more opaque to radiation, so as the star enters the re-expansion stage, it gets pushed by radiation, and expands too far. Similarly, when it finally contracts, it contracts too far. There is a specific “instability strip” on the HR diagram where you can find these stars. • 13
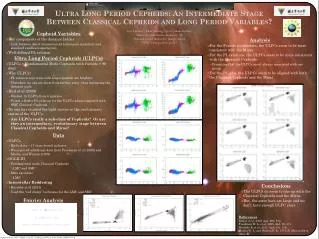
Cepheid Periodicity Much like the deep pitch (low frequency) of a large bell, and the high pitch (high frequency) of a small bell, Cepheid variables ring with different frequencies. Big, bright Cepheids take longer to oscillate than small, fainter ones. By measuring a Cepheid’s period, one can determine its luminosity. By comparing the luminosity to the Cepheid’s brightness in the sky, one can determine its distance. • 14
Calibrating Cepheids The period-luminosity relationship must be calibrated by Cepheids of a known distance. It was first done by Leavitt, using stars in the LMC and SMC. In modern times, techniques such as trigonometric parallax from Hipparcos are used to refine the relationship. Happily, Cepheids are inherently quite luminous (up to 3×10⁴L), so we can see them at tremendous distances. Cepheids have been found in: The Milky Way Galaxy; Large Magellanic Cloud (50 Kpc); Small Magellanic Cloud (60 Kpc); Andromeda Galaxy (0.8 Mpc); M100 (17 Mpc); NGC 4603 (33 Mpc); And other galaxies. • 15
Standard Candles Based upon the methods described so far, the distances of many star groups, clusters, star formation regions, galaxies, and galaxy clusters have been determined. As a result, all the objects in these groups/galaxies/clusters have had their distances determined. This lets us examine these objects, looking for “standard candles.” A standard candle is an object that, to a reasonable degree of reliability, has a predictable and consistent brightness, as if it were factory-built, conforming to a set of manufacturing standards. • 16
Proposed Standard Candles Brightest HII region luminosities Brightest HII region diameters Novae RR Lyrids/W Virginis stars Brightest O star in a cluster/galaxy Brightest K-M star in a cluster/galaxy Brightest X-ray flashes on neutron stars Brightest planetary nebula in a galaxy Brightest ellipticals in a cluster Third brightest galaxy in a cluster Type Ia supernovae • 17
Type Ia Supernovae Recall the scenario A binary system in which the compact companion is a white dwarf star near 1.44M. Mass flows from the expanding giant star, forming an accretion disk. Frequent novae occur. The white dwarf star approaches 99% the Chandrasekhar Limit. Uncontrolled C and O burning sweep through the white dwarf, releasing enough energy to unbind (blow up) the white dwarf. It is not thought that much (or anything) will remain of it. The giant may have its outer layers stripped off. In any event, it will fly away in a straight-line trajectory, as a high velocity star. • 18
Type Ia Supernovae A useful tool Being highly repeatable, it is thought that Type Ia supernovae are very consistent. The maximum luminosity is thought to be about 1010L (MB=-20). The brightness curve of a Type Ia can be identified (especially in the Blue band), and the maximum brightness inferred. Compared to the apparent brightness in the sky, the distance can be determined. ENORMOUS amounts of computational efforts have been made, to model/calculate the details, so we can use this tool as accurately as possible. Warning: the exceptionally rare coalescence of white dwarf double stars could also mimic the appearance of more conventional Type Ia supernovae, without the reliable brightness. • 19
Tully Fisher Relation Concept Lgalaxy (brightness) should be proportional to Mgalaxy. Lgalaxy should be proportional to its rotational speed (more massive galaxies spin faster; Newton’s laws). The rotation redshifts the spectrum on one side of a galaxy, and blueshifts the spectrum on the other side. Overall, this broadens the width of a spectral lines. Therefore, the width of spectral lines is related to Lgalaxy. Measure the galaxy’s linewidths (brightness), and compare this to its measured brightness in the sky to determine distance. This method ruled from around 1970-1990. • 20
Faber Jackson Relation The Tully Fisher relation can be adapted for elliptical galaxies too. While the stars in ellipticals do not orbit as stars in a spiral galaxy’s disk, they buzz around the center like a swarm of bees. Concept Brighter ellipticals are more massive. More massive galaxies have more gravity. More gravity means faster star motions. Faster stars mean broadened spectral lines. Measure the spectral linewidths, calculate the brightness, and compare it to how bright the elliptical looks in the sky. • 21
Hubble’s Law Working at Mt. Wilson Observatory, Hubble determined the distances to galaxies from a number of methods (Cepheids and standard candles), and from this he was able to infer that all distant galaxies are receding from us, following Hubble’s Law. v=Hd H=72 km/s/Mpc This law could be interpreted using Einstein’s theory of General Relativity. • 22