Download
1 / 48
480 likes | 576 Vues
3 rd edition. Charlotte H. Mason • William D. Perreault, Jr. The Marketing Game is Integrative … and Covers All Aspects of the Marketing Strategy Planning Process. Narrowing down to focused strategy with quantitative and qualitative screening criteria. Customers Needs and other

E N D
3rd edition Charlotte H. Mason • William D. Perreault, Jr. 1
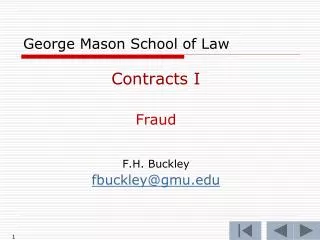
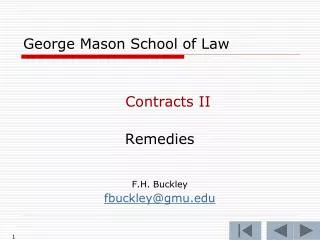
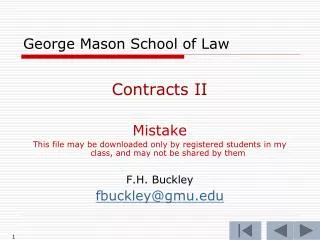
The Marketing Game is Integrative … and Covers All Aspects of the Marketing Strategy Planning Process Narrowing down to focused strategy with quantitative and qualitativescreening criteria Customers Needs and other Segmenting Dimensions Targeting & Segmentation Product Price S. W. O. T. Target Market Company Mission, Objectives, & Resources Positioning & Differentiation Promotion Place Competitors Current & Prospective External Market Environment Technology Political & Legal Social & Cultural Economic 2
Overview • You take over marketing management responsibilities for your firm. • Must satisfy customers and earn profits • Focus is on marketing strategy planning. • Requires integration of all strategy decisions. • Requires attention to competitive environment. • Considers short term and long term perspectives. • Features ongoing, rapid feedback. 3
The Process Analysis of market situation/opportunities Planning and budgeting Make marketing plan DECISIONS!!! Submit plan decisions The marketing game! simulation Company reports returned to firms Next Decision period 4
Industry Environment • Market growth • Technological environment • No major innovations expected • Yearly revision cycle • Competitive environment • Type of competition depends on firms’ decisions 5
High-tech Managers Modern Students Concerned Parents Professional Creators Harried Assistants Home Users Segments have different needs, preferences, situations, sizes, growth rates. Six Key Product-Market Segments 6
Past Sales By Market Segment For Voice Recognition Device 7
High-tech Managers Modern Students Concerned Parents Professional Creators Harried Assistants Home Users Distribution Channels Firm 1 Firm 2 Firm 3 Firm 4 Firms reach customers through full-service dealers and Internet/mail-order discount dealers. Channel 1 Traditional Dealers Channel 2 Discount Dealers Different segments have different shopping preferences. 8
Product 1: Voice Recognition Device (VRD) Number of Special Commands (5-20) Key Product Features Error Protection (1-10) Ability to Customize (1-10) 9
R&D for Product Modifications: Computing Costs Note: R&D for product changes is more expensive if you have to make big changes in a short period of time… 10
Level 3 Product 2: Digital Vocal Communicator (DVC) Number of Tasks (1-10) Key Product Features Similarity of Commands (1-10) Ease of Learning (1-10) 11
Types of Advertising • Pioneering • Direct competitive • Indirect competitive • Reminder • Corporate (Institutional) 12
Expanded Marketing Responsibilities (Level 2) PRODUCT Features (and R&D for product modifications) PRICE Wholesale price in each channel PLACE Distribution intensity in each channel PROMOTION -Advertising $ Spending Type -Personal selling Number of sales reps in each channel Percent non-selling time Commission rate -Sales promotion $ Spending per Channel CUSTOMER SERVICE $ Spending MARKET RESEARCH 7 Reports May be Purchased Demand Forecast/ Production order Number of Units 13
Expanded Marketing Responsibilities (Level 3) 2 PRODUCTs Features (and R&D for product modifications) PRICE Wholesale price in each channel for each product PLACE Distribution intensity by channel, product PROMOTION -Advertising $ Spending for each product Type for each product -Personal selling Number of sales reps in each channel Percent non-selling time in each channel Commission rate -Sales promotion $ Spending per channel, product CUSTOMER SERVICE $ Spending MARKET RESEARCH 7 reports may be purchased Demand forecast/ production order Number of units for each product 14
Marketing Budget Items (Level 2 and 3) • R&D product modification costs • Sales force salaries and severance pay • Advertising expense • Customer service expense • Sales Promotion Expense • Market research reports expense BUDGET FOR FIRST PERIOD: $984k 15
Discretionary Budget • Policy on initial discretionary budget. • Unspent money carries to future periods and earns interest. • “When it’s gone, it’s gone.” • Policy on special budget requests. 16
Computing Prices Computing Retail Prices from Wholesale Prices: Expected Retail Price = Wholesale price/(1-% Markup) Example: Wholesale price = $105 Channel 1 Retail Price = ($105/(1-.50)) = $210 Channel 2 Retail Price = ($105)/(1-.35) = $161.54 Computing Wholesale Prices from Desired Retail Prices: Wholesale Price = Retail Price (1 - % Markup) Example: Desired Retail Price = $190 Channel 1 Wholesale Price = $190/(1-.50) = $95.00 Channel 2 Wholesale Price = $190/(1-.35) = $123.50 17
Retail Prices Charged Final Consumers The retail price set by a dealer depends on: • The wholesale price in the dealer’s channel. • The customary markup used in the channel. • The portion of any sales promotion “deals” that the dealer passes along to consumers as a price reduction. 18
A “Good” Wholesale Price • Should cover the unit cost of the product (given its features). • Should result in a retail price that will appeal to target consumers. • Should result in a profit margin that will contribute to other expenses and profit. 19
Product Features and Prices Report Error protect- ion 3 3 3 3 Ease of learning 3 3 3 3 Retail price channel 1 $190.00 $190.00 $190.00 $190.00 Retail price channel 2 $146.15 $146.15 $146.15 $146.15 Brand of VRD Firm 1 Firm 2 Firm 3 Firm 4 Special commands 8 8 8 8 21
Market Activity Report (Level 2) Adv. Dollars Adv. Type Sales Promotion Channel 1 Channel 2 No. Sales Reps Channel 1 Channel 2 Commission Customer Service Firm 1 $250,000 $0 $0 10 10 5% $92,500 Firm 2 $250,000 $0 $0 10 10 5% $92,500 Firm 3 $250,000 $0 $0 10 10 5% $92,500 Firm 4 $250,000 $0 $0 10 10 5% $92,500 22
Overview of Market Research Reports • Market share by segment (all brands) • Market share by channel (all brands) • Consumer preference study • Marketing effectiveness report • Sales by segment by channel (own brand) • Consumer shopping habits study • Product positioning report (Level 2 & 3) 23
Market Share by Segment Report Segment 4 0.250 0.250 0.250 0.250 10,240 Brand Firm 1 Firm 2 Firm 3 Firm 4 Total Sales (units) 1 0.250 0.250 0.250 0.250 20,028 2 0.250 0.250 0.250 0.250 15,084 3 0.250 0.250 0.250 0.250 25,104 5 0.250 0.250 0.250 0.250 22,056 6 0.250 0.250 0.250 0.250 8,092 Who’s selling to whom? Who’s buying what? What is each firm achieving? Which segments are buying? 24
Market Share by Channel Report Brand Firm 1 Firm 2 Firm 3 Firm 4 Total Sales (units) Channel 1 0.250 0.250 0.250 0.250 56,296 Channel 2 0.250 0.250 0.250 0.250 44,308 What’s selling where? Who’s buying what? 25
Consumer Preference Study Price Range low low high high high low Special Commands 10-13 7-10 10-13 12-15 13-16 5-8 Error Protection 2-4 2-4 6-8 2-4 6-8 2-4 Ease of Learning 1-3 6-8 6-8 4-6 2-4 7-9 Segment Students Home Assistants Creators Managers Parents What kind of product would a segment prefer? What reference price seems typical for the segment? How are segments similar and different? 26
Competitors with lower Index 0 0 0 0 0 Competitors with equal or higher Index 3 3 3 3 3 Marketing Effectiveness Report Brand Awareness Customer Service Consumer Group Rating Industry Average Rating Channel 1: Sales Rep Workload Dealer Satisfaction Channel Strength (“Push”) Channel 2: Sales Rep Workload Dealer Satisfaction Channel Strength (“Push”) Index 0.550 100% 100% 100% 1.00 .500 100% 1.00 .500 27
Detailed Sales Analysis Segment Firm Channel 1 Channel 2 1 896 5,269 2 1,109 3,337 3 5,602 1,396 4 1,808 1,196 5 4,363 1,865 6 1,086 1,074 Unit sales by segment and channel Are you reaching your target? 28
Customer Shopping Habits Segment Students Home Assistants Creators Managers Parents Percent of Shopping in Channel 2 ? ? ? ? ? ? Percent of Shopping in Channel 1 ? ? ? ? ? ? Who shops where? How do shopping patterns match distribution focus? 29
Product Positioning Report Segment 3 ? ? ? ? 5 ? ? ? ? 6 ? ? ? ? Brand Firm 1 Firm 2 Firm 3 Firm 4 1 ? ? ? ? 2 ? ? ? ? 4 ? ? ? ? Which brands are closest to which segments? Which segments have no close brands? 30
Recommendations • Analyze the reports as you would analyze a case. • Make intentional changes. • Find a balance in marketing research spending. • Be integrative--think carefully about how each decision impacts each of the others. • Have some fun! 31
Market Research Reports (Level 2) • 1. Market share by segment (all brands) • 2. Market share by channel (all brands) • 3. Consumer preference study • 4. Marketing effectiveness report • 5. Sales by segment by channel (own brand) • 6. Consumer shopping habits study • 7. Product positioning report 33
Market Research Reports (Level 3) • 1. Market share by segment (all brands) • 2. Market share by channel (all brands) • 3. Consumer preference study • 4. Marketing effectiveness report • 5. Sales by segment by channel (own brand) • 6. Consumer shopping habits study • 7. Product positioning report Note: separate reports are available for each product, Except for the consumer shopping habits study 34
Submitting Marketing Plans • Submitting marketing plans decisions • Policy on paper form • Policy on electronic file • Each firm has a distinct industry and firm identification • Need to keep it straight! • Passwords and the TMGPlan software • Remember password used to create Plan • It is case sensitive (upper and lower case make a difference) • Best to stick to one password! 35
List of All Slides (with Hyperlinks) 1. Title slide 2. The Marketing Game: What Is It 3. A Little Background 4. Special Objectives Served by TMG The Role of the Marketing Game 6. Integrative Marketing Strategy Planning Process 7. Overview 8. The Process 9. Industry Environment 10. Six Key Product-Market Segments 11. Past Sales by Market Segment (VRD) 12. Distribution Channels 13. Product Features – Voice Recognition Device 14. Computing Costs of R&D for Product Mods 15. Product Features – Digital Vocal Communicator 16. Types of Advertising 17. Marketing Decision Responsibilities – Level 1 18. Expanded Marketing Responsibilities – Level 2 19. Expanded Marketing Responsibilities – Level 3 20. Production Economies of Scale 21. Response Functions 22. Budget Items – Level 1 23. Budget Items – Levels 2 and 3 24. Discretionary Budget 25. Computing Prices 26. Retail Prices Charged Final Consumers 27. A “Good” Wholesale Price 28. Competitor Analysis 29. Industry Sales Report 30. Product Features and Prices Report 31. Marketing Activity Report (Sample) 32. Market Research Reports – Level 1 33. Market Research Reports – Level 2 34. Market Research Reports – Level 3 35. TMG Software 36. Submitting Marketing Plans / Policies 37. Overview of Market Research Reports 38. Market Share by Segment 39. Market Share by Channel 40. Average Customer Preferences 41. Marketing Effectiveness Report 42. Detailed Sales Analysis 43. Customer Shopping Habits 44. Product Positioning Report 45. Recommendations 46. Blank side (end of show) 47. This list 36
Marketing Decision Responsibilities (Level 1) PRODUCT Features (and R&D for product modifications) PRICE Wholesale price PLACE Distribution intensity in each channel PROMOTION -Advertising $ Spending -Personal selling Number of sales reps in each channel CUSTOMER SERVICE $ Spending MARKET RESEARCH 6 reports may be purchased Demand forecast/ production order Number of units 37
Marketing Budget Items (Level 1) • R&D product modification costs • Sales force salaries and severance pay • Advertising expense • Customer service expense • Market research reports expense BUDGET FOR FIRST PERIOD: $984k 38
Market Research Reports (Level 1) • 1. Market share by segment (all brands) • 2. Market share by channel (all brands) • 3. Consumer preference study • 4. Marketing effectiveness report • 5. Sales by segment by channel (own brand) • 6. Consumer shopping habits study 39
Easy to use for preparing and evaluating plans, managing reports TMGPlan Software View, print, and manage password protected reports Select directory Enter Plan Decisions Evaluate spending and profit forecast 40
A Little Background • Originally developed as the first PC-based marketing strategy simulation in 1985 … • Routinely revised and updated since that time. • Now one of the most widely used teaching simulations in the world. • Used in hundreds of universities, exec programs and companies, international competitions, etc. • We’ll be using the third edition • You’ll need the student manual and accompanying CD-Rom (which has Windows software): The Marketing Game!, by Charlotte H. Mason and William D. Perreault, Jr., 3rd edition, published by McGraw-Hill/Irwin, Burr Ridge, Illinois, 2001. 41
Competitor Analysis • Estimate competitor’s net contribution • Analyze past strategies & likely changes. • Evaluate positioning and target segments. Firms 1 2 3 4 1 2 3 4 5 6 X ? X X Segments ? X ? 42
The Marketing Game: What is It? • A “living” case, where you learn about a situation, evaluate opportunities, develop a strategy, and make marketing plan decisions. • In which you get regular feedback, in a report that summarizes your marketing outcomes and related financial results, based on both your plan and competitors’ decisions. • Where you analyze what you’ve learned by doing … to figure out answers to what you do not know (and could not know!) at the beginning. • That challenges you to improveyour strategy in light of the learning... 43
The Role of the Marketing Game The Game offers unique learning advantages, compared to other learning approaches (like reading texts and articles, lectures, guest speakers, case analysis and presentation, projects) because it: • Is dynamic, like most business situations. • Brings the competitive aspects of marketing to life. • Highlights the need for integrative planning based on qualitative and quantitative analysis of the market environment. 44
Special Objectives Served by TMG • To develop skills in identifying marketing opportunities. This encompasses knowledge of and the ability to apply key marketing frameworks and tools for analyzing customers, competition, and marketing strengths and weaknesses. • To develop insights about creative selection of target markets and making integrative strategy decisions concerning product, price, promotion, place and the needs of a target market. • To develop skills in marketing analysis. • To provide meaningful, practical experience in translating qualitative and quantitative analysis into conclusions about profitable marketing strategies and programs. 45
Sales Saturation Level Threshold Level Marketing Spending Response Functions and Marketing Spending Spending too little may have little effect, but spending too much just increases costs and reduces profit. 46
Production Economies of Scale If the president decides to invest in new equipment, unit production costs will decline as cumulative production increases: 48