Download
1 / 28
280 likes | 366 Vues
The recommendation focuses on enhancing the Performance Funding Formula by allocating 5% of operating funds, totaling $61.4 million, to institutions. The formula prioritizes degree attainment, completion of credit hours, and research incentives while ensuring fair distribution and positive performance outcomes.

E N D
2011-13 CHE Higher Education Budget Recommendation House Ways & Means Committee – January 10, 2011
Overview • Priorities and Goals of the Recommendation • Performance Funding Formula • Overview • Operating • Debt Service • Repair and Rehabilitation • Capital • Line Items • Overall Summary • Institution by Institution Impact
Priorities and Goals of Recommendation • Provide funding above historical levels for the Performance Funding Formula • Allocate a portion of the operating base to fund the Performance Funding Formula • Distribute Performance Funding Formula based on priorities set forth by the Commission • Meet the budget base targets set forth by the State Budget Agency • Place Repair and Rehabilitation funding above new capital projects • Balanced the Performance Funding Formula based on mission differentiation of each institution • Align Performance Funding Formula outcomes with Reaching Higher
Performance Funding Formula • Established in 2003 with Research Incentive • Grown to 7 metrics used to provide performance funding to institutions • New situation in 2011-13 budget: No new dollars to allocate through the Performance Funding Formula • Recommendation stays consistent with the original development of the formula by creating incentives to institutions through the formula • Does not focus on penalizing institutions but rewards increased performance • Allows BSU and ISU to participate in the Successful Completion of Credit Hours metric
Funding the Performance Funding Formula • Across the Board reduction to operating budgets for each institution of 5% to fund the formula - $61.4 million • Performance Funding Formula will allocate the $61.4 million to institutions that performed well in the funding formula • Allocation of performance funding is based on: • Weighting each performance metric based on Commission distribution • Funding performance metrics with positive results, did not penalize institutions with negative performance metrics • ATB reductions and negative formula results would be a double hit to some institutions
Impact of Performance Funding Formula • Recommendation provides for 5% of the 2011 operating budget to be used towards Performance Formula Funding • $61.4 million for each year of the biennium • Total 2011 operating budget $1,228.8 million • Highest biennial funding of Performance Funding Formula since inception – 2003 • 2003-05 Biennium - $12.3 million – 1.0% of total ops budget • 2005-07 Biennium - $18.8 million – 1.6% of total ops budget • 2007-09 Biennium - $32.7 million – 2.5% of total ops budget • 2009-11 Biennium - $19.7 million – 1.6% of total ops budget • 2011-13 Biennium - $61.4 million – 5.1% of total ops budget
History of Performance Funding Formula ** Red font indicates a performance funding formula
Allocation of Performance Funding Formula • Based on distribution established by the Commission, the $61.4 million of Performance Funding Formula for each year of the biennium will be allocated in the following manner • TOTAL DEGREE ATTAINMENT CHANGE – 60% • Low Income Degree Attainment Change – 15% • On-Time Degree Attainment Change – 15% • Change in Overall Degree Attainment – 30% • TOTAL COMPLETION OF CREDIT HOURS – 25% • Successful Completion of Credit Hours – 18.7% • Dual Credit Successful Completion of Credit Hours – 5.5% • Early College Successful Completion of Credit Hours – 0.8% • RESEARCH INCENTIVE – 15%
Performance Funding Formula – High Level - 60% of the Performance Funding Formula, or $36.9 million, will go toward change in degree attainment - 25% of the Performance Funding Formula, or $15.4 million, will go toward successful completion of credit hours
Institutional Impact of Performance Funding Formula – Operating Only - Uses 100% of each performance metric for each year of the biennium - Only provides for positive performance metric results, does not include negative performance metric results (results are defaulted to $0) - Funded from a 5% across the board reduction to each institution/campus
Overview - Operating • Operating budget is impacted by the Performance Funding Formula • Recommendation reduces operating budget by 5% to fund Performance Funding Formula • Recommendation also reduces operating budget by 1.1% to account for the $13.7 million reduction in 2011 that is part of the State Budget Agency budget base target • Total net change in operating budget from 2011 to 2012 and 2013 is $13.7 million, the $61.4 million of Performance Funding Formula is reallocated among institutions based on performance
Operating Budgets General Fund – High Level Reduction to USI, Ivy Tech and BSU as part of $150 million cut Add $13.7 million back to allow for fair distribution of reduction $61.4 million for 5% ATB and $13.7 million for base target Represents a 1.1% reduction in the overall operating appropriation * 6.1% reduction includes $13.7 million (1.1%) from 2011 reduction and $61.4 million (5%) for Performance Funding Formula
Historical Operating Budget – General Fund ($’s in thousands)
CHE Operating Recommendation Comparison Most budget comparisons are made to current year spending levels. Higher Education operating budgets were reduced by $13.7 M in aggregate for 2011, spending less than what was appropriated.
Overview – Debt Service • Budget target from Budget Agency is the 2011 appropriation - $177.3 million • Funds previously issued debt for capital projects approved by CHE, the Budget Agency and the Governor • Funds all capital projects approved by the Commission up to the November 2010 meeting • All other General Assembly authorized projects not approved by CHE are not funded at this time • No newly requested capital projects are funded in this recommendation • Surplus funds available in debt services will be used to fund Repair and Rehabilitation
Debt Service General Fund – High Level Only funds capital projects previously approved by CHE. Does not include funding for any newly requested capital projects - 2011 to 2012 appropriation is 9.1% less - 2012 to 2013 appropriation is 3.9% less - 2011 to 2013 appropriation is 12.7% less
Overview – Repair and Rehabilitation • Recommendation – Fund Repair and Rehabilitation with surplus funds from debt service and line items and stay within the Budget Agency budget target • Provides for general fund dollars to be used towards Repair and Rehabilitation • For 2009-2011, no general funds were available for Repair and Rehabilitation. ARRA funds were used during the biennium totaling $31 million • Repair and Rehabilitation funding formula used to calculate overall need and then funding is adjusted to fit within Budget Agency target
Repair and Rehabilitation General Fund – High Level - Total R&R funding for biennium - $51.8 million - Represents 34.0% of R&R formula funded
Historical R&R Funding 1999-2013 – General Fund * Appropriation and disbursements include funding related to payment delay above formula driven R&R
Overview – Capital • Recommendation – No new, state funded, fee replacement eligible capital projects for the 2011-13 biennium • Institution requests for new capital for 2011-13 was $522 million • $267.9 million for renovation related projects • $254.1 million for new capital structures or additions • Total estimated fee replacement starting in 2013 would be $45.5 million • Only $20 million, or 3.8%, was provided as institutional match for the $522 million in capital projects
Historical Capital Project Funding * $’s in thousands
Overview – Line Items • Line items are specific programs, services or allocations: • University line items – each institution might have various line items • SSACI – student grants and awards • Leases – Dept. of Administration funding for lease payments related to state funded buildings • Budget Agency – various line items appropriated to SBA • CHE – administration and TransferIN funding • 2011 spending plans reduced line items by approximately $29.9 million, General and Dedicated Funds • Recommendation is to reduce line items by 15%, unless reductions were previously made as part of the 2011 spending plan or dedicated funds • 15% reduction results in approximately $6.4 million • SSACI is not part of the 15% reduction, reduced only $1.8M from 2011, mostly in administration. Major grants were held flat from 2011 • Surplus funds would be shifted to Repair and Rehabilitation
Line Items General and Dedicated Funds – High Level - 2011-13 appropriation recommendation includes $500K for TransferIN related to e-transcript costs - Adjustment between 2012 and 2013 is a reduction in lease costs associated with Animal Disease Lab
Overall Higher Education Budget Recommendation 2011-13 - Total % change from 2011 Spend to 2013 is 0.0% - Operating: 0.0% - Debt Service: (12.7%) - All Line Items: (2.1%)
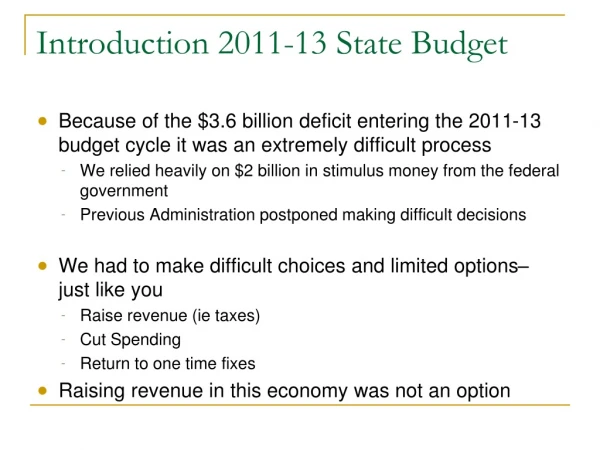
State Reductions to Higher Education • 43 states have implemented cuts to public colleges/universities • Alabama – 2010-11 cuts have led to tuition increases of 8% to 23% • Arizona – 9% increase in tuition and 20% increase in fees. 2.75% reduction in state-funded salary. Enacted payment delays of $100 million in 2011 • Colorado - $61.5 million reduction in 2011 • Georgia – cut state funding for higher education by $220 million in FY11 • Idaho – Imposing furloughs on 2,600 employees, cut state support by 7.8% in 2011 • Illinois – FY 2011, cut $100 million from higher education • Michigan – Reduced state student aid by $135 million (61%), $100 million in other areas of higher education • Minnesota – 9,400 students will lose financial aid from the state, those with aid will drop by 19%, FY 2011 - $146 million cut to higher education • Texas – FY 2011, 5% across the board cut, $439 million Sources: Center on Budget and Policy Priorities – Nov 2010 & NCSL Education Cuts July 2010