Download
1 / 23
230 likes | 451 Vues
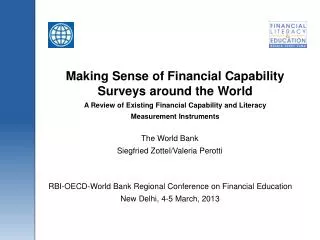
Mr Lyndwill Clarke Head: Consumer Education Ritz-Carlton Hotel Moscow 13 June 2013. Measuring Financial Literacy and Capability: Diagnostic Tools to Support Policy Development. Measurement of Financial Literacy in RSA. Before 2010 – Evaluation per project and programme

E N D
Mr Lyndwill Clarke Head: Consumer Education Ritz-Carlton Hotel Moscow 13 June 2013 Measuring Financial Literacy and Capability: Diagnostic Tools to Support Policy Development
Measurement of Financial Literacy in RSA • Before 2010 – Evaluation per project and programme • 2010 OECD Pilot Study • 2011 Baseline Study • 2012 SASAS
Why Measure Financial Literacy? Financial Literacy • Set a baseline – needs/gap analysis • Influence policies, strategy and programme design • Impact assessment • (TO SEE IF CFE WORKS?)
From Pilot to Baseline to Annual Study SA BASELINE ANNUAL SURVEY OECD PILOT Financial control 8 Financial control 8(23) BEHAVIOUR 9 ATTITUDE 4 KNOWLEDGE 8 Financial Inclusion Financial planning 5(18) Financial planning 5 Products choice 12(63) Products choice 12 Financial knowledge 8 (35) Financial knowledge 8
Study Methodology • Survey conducted by Human Sciences Research Council (HSRC) • Nationally representative of the population 16 years and older living in private households in the 9 provinces • Primary sampling units: 500 census enumerator areas (EAs), stratified by province, geography type and majority population group • Secondary sampling units: 7 household visiting points randomly selected per EA • One respondent 16+ years randomly selected per household • Of 3,500 addresses issued 2,518 (2,972 – 2011) interviews achieved • Responses to the survey voluntary and confidential, collected by face-to-face interview • Data collection: November-December 2012
Making Ends Meet • 45% personally experienced income shortfalls last year • Little difference in response between 2010 and 2012. • Two common coping responses: borrowing from family/friends (41%); cutting back on spending or doing without (43%) – nominal reliance of financial products. • Increase in the share of South Africans cutting back on spending as a coping strategy between 2012 (43%), 2011 (35%) and 2010 (30%). • Decline in the share of South Africans borrowing from family/friends as a response to income shortfall between 2012 (41%) and 2011 (55%). • Most important coping mechanism for South Africans is cutting back on expenditure or doing without (31%) • This was primarily a coping strategy is more common among middle income South Africans; the poor are more reliant on social networks
Savings Behaviour • Significant majority saved in at least one type of savings instrument • Signs of declining ability to save over last 3 years
Behaviour and Attitudes to long-termplanning • 52% of the adult population always/often sets and pursues long-term financial goals; 22% sometimes; 22% doing so seldom or never. • 39% find it more satisfying to spend money than to save it for the long term (45% preferred saving and 13% remained neutral) • 29% reported that they tend to live for today and let tomorrow take care of itself (53%preferred to plan for tomorrow; 18% remained neutral) • 42% believed that money is there to be spent (37%preferred to save and 21% remained neutral). Attitudes have not changed appreciably since 2010. but Signs of declining ability to save over last 3 years
Financial knowledge and understanding
Trend and Subgroup Differences on the Financial Quiz • BASIC ARITHMETIC: 2010 only four-fifths answered the question correctly compared with almost nine out of ten (86%) in 2012. • UNDERSTANDING OF INFLATION: more people answered this question incorrectly in 2012 when compared with 2011. • UNDERSTANDING OF INTEREST AND COMPOUND INTEREST: the share answering this question correctly did not change significantly over the period. • The share giving an incorrect answer on the interest rate question and compound interest question was greater in 2012 than in 2011 and 2010.
Overall Scores, 2011-2012 and Composite measure Financial Control Financial Planning Appropriate Product Choice Financial Knowledge & Understanding Overall Financial Literacy Score
Way forward • Repeat core financial literacy core module year-on-year • Next Baseline study – 2016 • Challenge: Integrating programme and project survey and M & E statistics into Baseline and Annual survey
THANK YOU FOR YOUR ATTENTION Mr Lyndwill Clarke HOD: Consumer Education Financial Services Board – South Africa E-mail: Lyndwill.Clarke@fsb.co.za Tel: (+27) 12 422 2819 Mobile: (+27) 79 881 1805 www.fsb.co.za www.mylifemymoney.co.za