Download
1 / 14
140 likes | 242 Vues
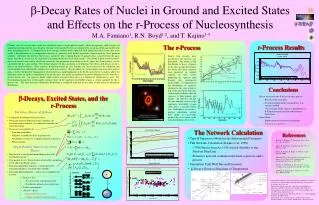
This workshop focuses on beta strength calculations for nuclei near the 3rd r-process peak. Emphasis is on comparing model calculations with experimental data to obtain T1/2 and Pn values. Total Absorption Gamma-ray Spectroscopy with large scintillation detectors is used for more precise analysis. The region close to 208Pb and 202Ir is explored using FF and GT microscopic models. Accessible nuclei like 204Au and 203Pt are studied for better insights.

E N D
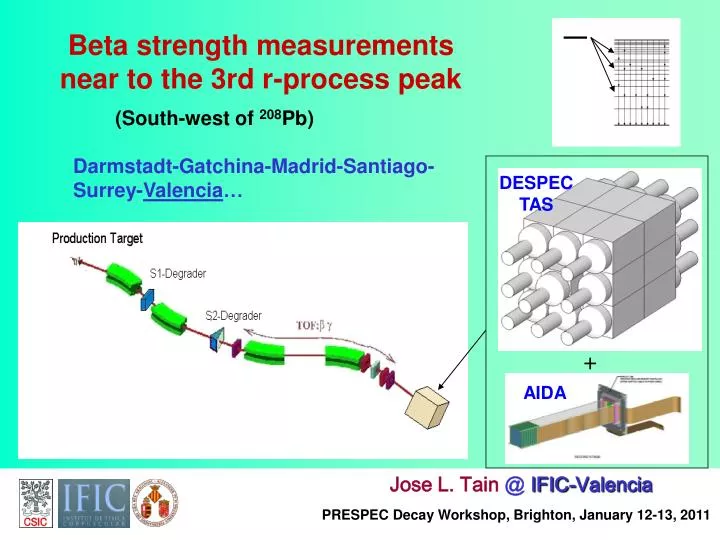
Beta strength measurements near to the 3rd r-process peak (South-west of 208Pb) Darmstadt-Gatchina-Madrid-Santiago-Surrey-Valencia… DESPEC TAS + AIDA Jose L. Tain @ IFIC-Valencia PRESPEC Decay Workshop, Brighton, January 12-13, 2011
Beta strength calculations are needed in order to obtain T1/2 and Pn values for most of the nuclei involved in r-process calculations : 0+ Fermi : 1+ Gamow-Teller : 0-,1- Non-unique first forbidden : 2- Unique first forbidden … • The quality of the model calculations is judged by comparison with experimental T1/2 and eventually Pn values in particular for the most neutron rich accessible nuclei, which are however integral quantities • Direct comparison of calculated and measured S provides a more stringent test of the nuclear structure models
Total Absorption Gamma-ray Spectroscopy: • Uses large 4 scintillation detectors,aimingto detect the full -ray cascade rather than individual -rays -decay real TAS spectrum (deconvolution) strength ideal TAS (=100%) Inverse problem MC simulations + know level sch. + statistical model
FF GT “South-west” of 208Pb • “Close” to r-process 3rd abundance peak • Decay dominated by FF transitions • Largely unexplored but accessible at GSI r-process
200Os (Z=76, N=124) • Borzov, Phys.At.Nucl. (2011) • DF+QRPA • both GT and FF microscopic • no deformation Q = 2.6 MeV (SY) Expected number of levels: Nlev=800 Goriely et al. PRC78(08) 064307
202Ir (Z=77, N=125) Expected number of levels: Nlev=4.1104 Q = 5.4 MeV (SY)
|2| deformation • Further into the play: deformation Moeller et al., ADNDT59(95)185 (Exp: NuDat)
PRC67(03)055802 : GT+FF ADNDT66(97)131 : GT • Moeller et al. • FRDM+QRPA • FF from Gr.Th. • deformation • exper. Q, Sn T1/2 Pn
DF3: Borzov, Phys.At.Nucl. (2011), FRDM: Moeller et al., PRC67(03)055802 Z=76 Z=77 Z=78 Z=79
J. Benlliure et al., NIC XI, Heidelberg, 2011 • Region accessible with enough statistics (204Au,204,203Pt, 201Ir,…) 208Pb (1GeV/u) + Be (2.5g/cm2) • T. Kurtukian et al., NPA827 (2009) 687c • A.I. Morales, PhD Thesis, U. Santiago, 2011
A.I. Morales, PhD Thesis, U. Santiago, 2011 Q = 2.3 MeV (SY) Q = 5.4 MeV (SY) Nlev=2.7103 Nlev=4.1104
J. Benlliure et al., NIC XI, Heidelberg, 2011 C. Domingo-Pardo et al., Experiment S410
16 + 1 modules: 151525 cm3 NaI(Tl) + 5” PMT (50% light col.) V= 95 L, M= 351 kg PROTOTYPE RE= 6.8% @662keV t(FWHM) = 4.5 ns Light collection MC simulation Exp. • Half detector will be ordered this year • The rest in 2012