Download
1 / 20
200 likes | 306 Vues
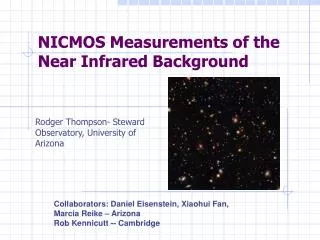
NICMOS Measurements of the Near Infrared Background. Rodger Thompson- Steward Observatory, University of Arizona. Collaborators: Daniel Eisenstein, Xiaohui Fan, Marcia Reike – Arizona Rob Kennicutt -- Cambridge. Questions For This Conference.

E N D
NICMOS Measurements of the Near Infrared Background Rodger Thompson- Steward Observatory, University of Arizona Collaborators: Daniel Eisenstein, Xiaohui Fan, Marcia Reike – Arizona Rob Kennicutt -- Cambridge
Questions For This Conference • Is there a Near Infrared Background Excess (NIRBE) at 1.4 mm that is due to the very first stars? (Matsumoto et al. 2005) • Are the spatial fluctuations in source subtracted 1.6 mm deep images due to the very first stars? (Kashlinsky et al. 2002) • Are the fluctuations in deep source subtracted Spitzer images at 3.5 and 4.6 mm due to the very first stars? (Kashlinsky et al. 2005, 2007) • Define very first stars as stars in galaxies at z>10.
Near Infrared Background Excess at 1.4mm from NIRS on IRTS Matsumoto et al. 2005 DIRBE Possible Lyman Limit at z~15? NICMOS Spectral region considered in this talk. HST Optical
NICMOS Image of the Ultra-Deep Field UDF NIRS Aperture
NICMOS Zodiacal Background Measurement Dithered Images Median of the 144 50” images measures the zodiacal background Subtracted from all images to form the final image
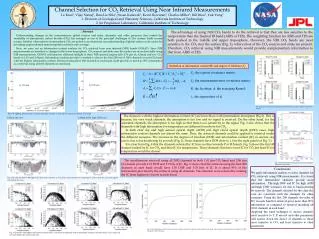
Distribution of Flux Between Background Components Measured Modeled Flux in nW m-2 ster-1
Conclusion on NIRBE • There is no NIRBE. • The NIRB is 7 nw m-2 str-1. • The NIRS NIRBE was created by inadequacies of the zodiacal model. • The primary NIRB comes from galaxies in the redshift range of 0.5-1.5. • The NIRB is resolved into low z galaxies and the signature of the very first stars is below our detection level.
NIRB Fluctuations • Fluctuation Observations • 2MASS (Kashlinsky et al. 2002) • NUDF (Thompson et al. 2007) • SPITZER (Kashlinsky et al. 2005, 2007) • Projections from Thompson et al. (2007) • Major Question: Are the fluctuations due to very high redshift galaxies, possibly Pop.III or normal, lower redshift galaxies.
1.6 mm Fluctuation Analysis (1.1 mm is identical) Kash. 02 2MASS fluctuations
Which Redshifts Contain the Majority of the Fluctuation Power? Background Flux and Fluctuations Peak at Redshift ~ 1
NICMOS Fluctuation Conclusions • The observed fluctuations in the 1.1, 1.6 mm and 2MASS source subtracted backgrounds are due to galaxies with redshifts between 0 and 7 • The majority of fluctuation power is from galaxies at redshifts between 0.5 and 1.5 • There is residual power in the NICMOS source subtracted background
What is the Nature of the NICMOS and SPITZER Source Subtracted Backgrounds? • There are observations of the source subtracted background fluctuations at • 1.1 and 1.6 mm, NICMOS UDF observations • 3.6 and 4.5 mm, IRAC GOODS observations • The source subtractions are to equal depth in each of the fields • We will use the color of the fluctuations as a key to their nature
Predicted Color from the Spectral Energy Distributions (SEDs) • We know the predominant SEDs in the NUDF 1- Early Cool SED to 7- Late Very Hot SED
Fluctuation Color Conclusions • The 1.1 to 1.6 mm fluctuation color is inconsistent with galaxies at z>8 • The 1.6 to 3.6 mm fluctuation color is inconsistent with galaxies at z>10 • There are no properties of the 1.1 to 4.5 mm source subtracted background fluctuations that require very high redshift, possibly population III stars. • The fluctuation properties are consistent with faint z = 0.5-1.5 galaxies below the detection limit.
Are There Galaxies in the UDF Below Our Detection Limit? - YES Magnitude Distribution of NUDF Galaxies
Fluctuation Spatial Spectrum • Part of the justification of SPITZER fluctuations being due to high z sources is that the spatial spectrum fits that expected from high z sources. • Raises the question as to whether the spatial spectra of the SPITZER and NICMOS fluctuations are similar • NICMOS limited to spatial scale of 100 arc seconds and less.
Comparison of the SPITZER and NICMOS Fluctuation Spectra Spectra normalized at 10”
Comparison Conclusion • Spatial spectra of the fluctuations are the same out to 100 arc seconds. • Indicates the spatial spectrum of low redshift sources has the SPITZER shape out to 100 arc seconds. • SPITZER fluctuations measured by hand from Fig. 1, Kashlinsky et al. 2007, Ap.J, 654, L5. • Larger scale near infrared images are needed to extend the spatial range
Final Conclusions • The purported NIRBE at 1.4 mm does not exist. • The NIRB has been resolved into galaxies predominantly at z = 0.5-1.5 • The observed fluctuations are mainly due to galaxies at z = 0.5-1.5 • The colors of the NICMOS and SPITZER source subtracted background fluctuations are consistent with low redshift galaxies and inconsistent with galaxies at z > 10. • The spatial structure of the fluctuations is the same for NICMOS and SPITZER, indicating a low redshift origin for both. • These conclusions are limited to fluctuations on spatial scales of 100 arc seconds and less. • There is no aspect of the current near infrared background measurements that requires galaxies at Z > 10. • The most likely source of the source subtracted background fluctuations is the faint extended emission of the subtracted sources that is fainter than our detection limit.