Download
1 / 31
310 likes | 503 Vues
Deep Blue group: N. Christina Hsu (PI), Andrew M. Sayer, Corey Bettenhausen, Nick Carletta , M. J. Jeong, Jaehwa Lee Dark Target group: Rob Levy (PI) , Shana Mattoo, Leigh Munchak, Falguni Patadia, Pawan Gupta, Rich Kleidman

E N D
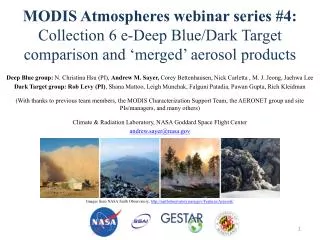
Deep Blue group: N. Christina Hsu (PI), Andrew M. Sayer, Corey Bettenhausen, Nick Carletta , M. J. Jeong, Jaehwa Lee Dark Target group:Rob Levy (PI), Shana Mattoo, Leigh Munchak, Falguni Patadia, Pawan Gupta, Rich Kleidman (With thanks to previous team members, the MODIS Characterization Support Team, the AERONET group and site PIs/managers, and many others) Climate & Radiation Laboratory, NASA Goddard Space Flight Center andrew.sayer@nasa.gov MODIS Atmospheres webinar series #4: Collection 6 e-Deep Blue/Dark Target comparison and ‘merged’ aerosol products Images from NASA Earth Observatory, http://earthobservatory.nasa.gov/Features/Aerosols/
Motivation • Q: The Collection 6 MODIS atmosphere aerosol products over land have e-Deep Blue (DB), Dark Target (DT), and ‘merged’ data all available a lot of the time. Which should I use, and when? • A (short): It depends. • A (longer): The next ~45 minutes…
Overview • Aerosols and MODIS overview • MODIS Deep Blue/Dark Target summary • Global/regional comparison of retrievals • ‘Merging’ algorithm • Description • Examples • Evaluation against AERONET
Overview • Aerosols and MODIS overview • MODIS Deep Blue/Dark Target summary • Global/regional comparison of retrievals • ‘Merging’ algorithm • Description • Examples • Evaluation against AERONET
Aerosols and properties of interest: AOD • Aerosol Optical Depth (AOD): total column optical extinction of aerosol at a given wavelength • Most commonly, 550 nm (τ550) • Related to how much aerosol is in the atmosphere • Also termed aerosol optical thickness (AOT)
Moderate Resolution Imaging Spectroradiometer (MODIS) terminology MxD04_L2.AYYYYDDD.HHMM.CCC.YYYYDDDHHMMSS.hdf MxD04 = Earth Science Data Type name x = “O” for Terra or “Y” for Aqua L2= Denotes a Level-2 product (or L3 for Level-3, etc.) A= indicates date/time information follows YYYYDDD = acquisition year and day-of-year HHMM = acquisition hour and minute start time CCC = collection (e.g., ‘006’ for Collection 6) YYYYDDDHHMMSS = production data and time hdf= denotes HDF file format • A ‘Collection’ is a MODIS mission (re)processing; Collection 6 is the new version • Data products relevant to this presentation: • MOD04, MYD04 Level 2 (orbit-level) aerosols • MODATML2, MYDATML2 Level 2 joint atmospheres • MOD08, MYD08 Level 3 (aggregated) joint atmospheres
The MODIS sensor • 36 spectral bands from visible to thermal IR • Spatial resolutions (level 1b) 250 m to 1 km at nadir • ‘Bowtie effect’ leads to pixel enlargement and distortion near swath edges • Swath width 2,300 km, giving near-global daily coverage • Flying on polar-orbiting platforms • Near-constant local solar time of observation ~10:30 am (Terra, descending), ~1:30 pm (Aqua, ascending) • 14-15 orbits per day, 16-day orbital repeat cycle • Data organised into 5-minute ‘granules’ MODIS Terra daytime RGB composite for July 12th, 2013 MODIS Aqua granule RGB composite for August 14th, 2003, 12:05 UTC Images available online at http://modis-atmos.gsfc.nasa.gov
Overview • Aerosols and MODIS overview • MODIS Deep Blue/Dark Target summary • Global/regional comparison of retrievals • ‘Merging’ algorithm • Description • Examples • Evaluation against AERONET
MODIS Atmospheres aerosol products basics Browse images from http://modis-atmos.gsfc.nasa.gov/IMAGES/index.html • Level 2 (MxD04) nominal pixel resolution10x10 km at nadir • Other aerosol algorithms (not discussed here) exist, e.g. : • MODIS: MAIAC, land/ocean surface ‘atmospheric correction, regional algorithms • Non-MODIS sensors too (e.g. MISR, SeaWiFS, VIIRS, AVHRR, POLDER, ATSR, MERIS, geostationary, etc…) RGB DT/ocean Three aerosol algorithms in MxD04: Enhanced Deep Blue (DB/eDB, land only) Dark Target (DT, dark land only) Ocean (water only) DB
MODIS aerosols as of Collection 5 • Ocean: one algorithm • Land: two algorithms, minimal spatial overlap • Dark Target algorithm over (mainly) vegetated surfaces • Deep Blue algorithm over bright surfaces (e.g. deserts) • In C6, it does more than that • This provided the initial rationale for the merge
Algorithm summaries • All algorithms are only applied over daytime, cloud-free, snow/ice-free pixels • All results shown hereafter, unless noted otherwise, are: • Only for retrievals passing each algorithm’s quality assurance (QA) checks • For Aqua data • For AOD at 550 nm
Seasonality of AOD • Seasonal mean AOD: • Left column: DB • Middle column: DT • Right column: DB-DT difference • Maps use only colocated retrievals • Similar global AOD patterns and seasonal cycles • Regional/seasonal offsets, often within retrieval uncertainty
Correlation between DB and DT • Over much of the world, DB and DT AOD are highly correlated (r>0.9) within a season • That does not imply that they are correct • Lower correlations where AOD is persistently low, and/or surface conditions tricky for one/both algorithms • Australia, Sertão area of Brazil, mountains
Sampling rate • Ratio of number of retrievals passing QA checks, for regions where both algorithms provide retrievals • DB tends to provide retrievals more frequently at mid/high-latitudes (purple) • DT tends to provide retrievals more frequently in the tropics (red) • In North America, Europe and India, often similar data volume
Granule-level comparisons • Sampling frequency in tropical reasons determined in part by occurrence of small cumulus clouds • DB discards more data than DT near cloud edges
Granule-level comparisons • Where other cloud types dominate, extent of near-cloud spatial coverage tends to be more similar
Overview • Aerosols and MODIS overview • MODIS Deep Blue/Dark Target summary • Global/regional comparison of retrievals • ‘Merging’ algorithm • Description • Examples • Evaluation against AERONET
What is the ‘merged’ MODIS dataset? • This first attempt largely mimics Collection 5 user habits: use Deep Blue to fill in gaps in the Dark Target/ocean dataset • Only contains retrievals passing QA checks • 12 monthly climatologies of NDVI used to assign retrievals over land: • NDVI < 0.2: Deep Blue • NDVI > 0.3: Dark Target • Otherwise: pick the algorithm with higher QA value, else average if both QA=3 • Ocean algorithm used over water
Seasonal average ‘merged’ AOD • Seasonal mean of daily mean AOD from the ‘merged’ SDS, 2006-2008
Overview • Aerosols and MODIS overview • MODIS Deep Blue/Dark Target summary • Global/regional comparison of retrievals • ‘Merging’ algorithm • Description • Examples • Evaluation against AERONET
Evaluation against AERONET Images from NASA AERONET page, http://aeronet.gsfc.nasa.gov/ Comparison methodology: Average AERONET AOD within 30 minutes of satellite overpass Average MODIS AOD within 25 km of AERONET site Compare AOD at 550 nm • Aerosol Robotic Network (AERONET): A standard resource for satellite AOD validation • Global network with consistent protocols, reference calibration • Several hundred sites with at least 1 year of observations • Also have a ship-borne Maritime Aerosol Network for over-ocean coverage (not shown)
DB vs. DT: surface-related biases • Median (symbols) and confidence envelopes (68%, 90%) of DB and DT AOD bias vs. AERONET with respect to swIR NDVI, for low-AOD cases • Higher swIR NDVI for (generally) a more densely-vegetated surface • Shows similar (small) biases in both datasets, DT has more scatter at less-vegetated surfaces • These low AOD cases are a majority (~80% of points)
DB vs. DT: aerosol-related biases • Median (symbols) and confidence envelopes (68%, 90%) of DB and DT AOD bias vs. AERONET AOD, split by AERONET Ångström exponent (AE) • Left plot: low AE (e.g. dust) • DB has slight low bias, DT has bias becoming more negative with increasing AOD • Right plot: high AE (e.g. smoke, urban pollution) • DT has little bias, DB has bias becoming more negative with increasing AOD • Width of error distributions similar • These high AOD cases are a minority (<10%) of points
Global comparison • Maps show ‘best’ algorithm, by different metrics, at each AERONET site • Gold: merged SDS takes only DB or DT retrievals; Red: merged mixes DB and DT, and does better than both • Which is best depends on what statistical metric you’re interested in • The merged dataset tends to have a higher data volume • However, DB or DT outperform by other metrics at some sites • Thus, usage choices may depend on whether analyses are regional or global
Where does performance quality differ? • As before, but only where different in algorithm quality is large • Fewer sites plotted, i.e. level of performance is similar at many sites
Example: Banizoumbou (Niger) Dark Target Deep Blue Merge • DB performs well • DT has few retrievals • Merge mostly draws from DB (blue) Map from Google Earth
Example: Shirahama (Japan) Dark Target Deep Blue Merge • DT performs well, slight high bias • DB has fewer retrievals, and low bias • Merge mostly draws from DT (green) Map from Google Earth
Example: Pune (India) Dark Target Deep Blue Merge • Both DB and DT perform well • Merge sometimes draws from DT (green), sometimes DB (blue), sometimes merges (red) • Slightly better performance overall from the merge than either DB or DT Map from Google Earth
Summary • Deep Blue (DB) and Dark Target (DT) provide similar views of the global aerosol system from MODIS • Often agree closely, but this doesn’t imply both are correct, and should not be considered as independent datasets • Neither algorithm, or their merge, is consistently better than the others • Quality of performance is often very similar between algorithms • In many areas, it will likely not matter much which algorithm is used • Usage recommendations are more complicated than can be presented concisely • DB is still the only option over deserts, and there is only one ocean algorithm, so for global analyses use of the merge may be simplest • Encourage users to do analyses with both DB and DT data, where practical • We expect results for Terra will be quantitatively similar • Please contact us with questions, comments, interesting results Links: MODIS Atmospheres website: modis-atmos.gsfc.nasa.gov NASA LAADS (data distribution) website: ladsweb.nascom.nasa.gov MODIS Collection 6 on the NASA LAADS ftp server: ladsweb.nascom.nasa.gov/allData/6/<product name>