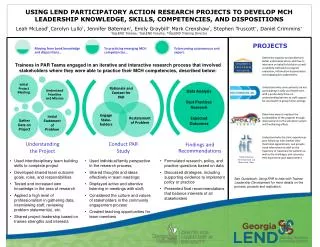
Analyzing Membrane Proteins in Metagenomics: Correlating Environmental Features and Protein Families
This thesis explores the intricacies of membrane proteins within metagenomic studies, emphasizing their roles in environmental responses and adaptations. By examining correlated environmental features and protein families, it sheds light on how different habitats influence the variability of membrane proteins. The research utilizes data from the Sorcerer II Global Ocean Survey, involving extensive metagenomic sequencing and environmental metadata. It provides insights into microbial pathways and their significance in understanding microbial diversity and adaptation to diverse ecological niches across different environments.

Analyzing Membrane Proteins in Metagenomics: Correlating Environmental Features and Protein Families
E N D
Presentation Transcript
Analysis of Membrane Proteins in Metagenomics: Networks of correlated environmental features and protein families Prianka Patel, Thesis DefenseYale UniversityMolecular Biophysics and Biochemistry2.17.10
# Coevolving pairs Bowie, James Nature, 2005 Sequence Separation Photosynthesis Projects Analysis of Membrane Protein Structures Metagenomics of Ocean Microbes: Co-variation with Environment
Contig 1 Contig 2 . . . . . . What is Metagenomics? Traditional Genomics Metagenomics Collect sample from environment Select organism and culture atgctcgatctcg atcgatctcgctg atgccgatctaa atgctcgatctcg atcgatctcgctg atgccgatctaa Extract DNA and sequence Extract DNA and sequence Assemble and annotate Assemble and annotate Estimated that less than 1% of microbes can be cultured Lose information about which gene belongs to which microbe
Comparative Metagenomics = Average Sargasso Sea 2 Sargasso Sea 4 Sargasso Sea 3 Whale 1 (bone Whale 2 (bone) Whale 1 (microbial mat) Acid mine Drainage Minnesota farm soil Foerstner et al., EMBO Rep, 2005 GC content is shaped by environment Very different environments: whale bone associated, ocean, acid mine, soil An amino acid change in Proteorhodopsin proteins is linked to abundant wavelengths in the sample of origin
Comparative Metagenomics invariant variant Photosynthesis Dinsdale et. al., Nature 2008 Gianoulis et al., PNAS 2009 There are microbial pathways that discriminate between categorically different environments There are microbial pathways that discriminate between similar environments
Motivation Membrane proteins interact with the environment, transporting available nutrients, sensing environmental signals, and responding to changes Engelman et al., Nature, 2005 Variation in membrane proteins across different environments may give insight into microbial adaptations that allow them to survive in a specific habitats.
Sorcerer II Global Ocean Survey Sorcerer II journey August 2003- January 2006 Sample approximately every 200 miles Rusch, et al., PLOS Biology 2007
Sorcerer II Global Ocean Survey Metadata GPS coordinates, Sample Depth, Water Depth, Salinity, Temperature, Chlorophyll Content Metagenomic Sequence 0.1–0.8 μm size fraction (bacteria) 6.3 billion base pairs (7.7 million reads) Reads were assembled and genes annotated The majority of samples are from open ocean, with a few estuaries and lakes Each site has its own metadata Assembly was done over all locations, but can be mapped back to a particular site Rusch, et al., PLOS Biology 2007
Extracting environmental data using GPS Coordinates Sample Depth: 1 meter Water Depth: 32 meters Chlorophyll: 4.0 ug/kg Salinity: 31 psu Temperature: 11 C Location: 41°5'28"N, 71°36'8"W Sample Depth: 1 meter Water Depth: 32 meters Chlorophyll: 4.0 ug/kg Salinity: 31 psu Temperature: 11 C Location: 41°5'28"N, 71°36'8"W GOS GPS coordinates allow us to extract information from other sources: • * World Ocean Atlas • * National Center for Ecological • Analysis and Synthesis
World Ocean Atlas 2005NOAA (National Oceanic and Atmospheric Administration) and NODC (National Oceanographic Data Center) Annual Phosphate [umol/l] at the surface * Cumulative annual data at the ocean surface * Resolution is 1 degree latitude/longitude . . . no simple geometric shape matches the Earth Nutrient Features Extracted: Phosphate Silicate Nitrate Apparent Oxygen Utilization Dissolved Oxygen
National Center for Ecological Analysis and Synthesis (NCEAS) * Resolution is 1 km square * Value of a activity at a particular location is determined by the type of ecosystem present: Impact = ∑ Features * Ecosystem * impact weight Shipping Anthropogenic Features Extracted: Ultraviolet radiation Shipping Pollution Climate Change Ocean Acidification Climate Change Halperin et. al.(2008), Science
Predicting membrane proteins in GOS data Metagenomic Reads Protein Clusters Membrane Protein Clusters - TMHMM (Transmembrane Hidden Markov Model): finds hydrophobic stretches of amino acids - COG (Clusters of Orthologous Groups): orthologous groups of protein families Family 1 * 151 Families TMHMM GOS Mapping COG Filtering Family 2
Predicting membrane proteins in GOS data 22% of unique proteins in membrane protein clusters map to COG
What is the Relationship? Membrane Protein Families Environmental Features • Correlation of Sites based on environmental features or protein families • Discriminative Partition Matching • Canonical Correlation Analysis/Protein Features and Environmental Features Network ?
Species Distribution • The 16S rRNA gene is a component of the small prokaryotic ribosomal subunit • Bacteriawith 16S rRNA gene sequences more similar than 97% are considered the same ‘species’ • 10,025 16S genes found and classified Biers et al. App. Env. Microbiology , 2009 20% level, “phylum”
This suggests that the observed membrane protein variation is more a function of the measured environmental features, than phylogenetic diversity. Method: For each site, we correlated the EF profile distances and its MPF frequency profile distances and 16S profile distances
Discriminative Partition Matching Sites cluster into three distinct groups: Which membrane protein families are discriminating between these clusters? We can partition the membrane protein family matrix by these site groupings, and then look for significantly different distributions of proteins families between the clusters. Groups are geographically separated:
Discriminate Partition Matching First, we performed PCA on the membrane protein families matrix, and grouped the first component scores by the environmental clustering This revealed that the Mid-Atlantic and Pacific were more similar to each other in terms of membrane protein content, and these sites were grouped Which families are discriminating between these two site-sets? (T-test)
DPM results • 30 families showed significant differences (p-value<0.01) between the site sets • Most were enriched in the North Atlantic (28/30) • Higher pollution, chlorophyll, and possibly higher nutrients and cell abundance in the North Atlantic microbes’ need to expel antimicrobials, by-products of metabolism, or environmental toxins Buffer against shifts in ocean solute concentrations again alluding to the increased pollutants, and possibly nutrient fluxes from land and rivers Chlorophyll content Stabilization of DNA and RNA Exchanges ATP for ADP in mitochondria and obligate intracellular parasites, may be nucleotide/H+ transporters
Salinity Pollution Temp Simultaneous Correlations of Environmental Features and Membrane Proteins Canonical Correlation Analysis Environmental Features Membrane Protein Families ? We have addressed this questions by: 1. Comparing site similarity based on these two sets of features 2. Finding particular discriminating families between environmental groupings But we don’t know what particular features are associated with each other, and we know that they are all likely interdependent: Canonical Correlation Analysis Family 1 Family 2 Family 5
Canonical Correlation Analysis • CCA allows us to take advantage of the continuity of the features and observe which features are invariant or variant, and the type (positive, negative) of relationship between them. • We correlate all the variables, protein families and environmental features simultaneously. • We have two sets of variables, X1. . . X15 (environmental features) and Y1. . . Y151 (membrane protein families) Environmental Features Membrane Protein Families We are looking for two vectors, a and b (a set of weights for X and Y), such that the correlation between X, Y is maximized:
CCA results We are defining a change of basis of the cross co-variance matrix We want the correlations between the projections of the variables, X and Y, onto the basis vectors to be mutually maximized. Eigenvalues squared canonical correlations Eigenvectors normalized canonical correlation basis vectors Environment Family Correlation= 1 This plot shows the correlations in the first and second dimensions Correlation Circle: The closer the point is to the outer circle, the higher the correlation Variables projected in the same direction are correlated Correlation = .3
CCA results 107 variant membrane protein families 44 invariant membrane protein families Difficult to see the strength and directionality of a relationship Weights of the features are difficult to visualize and compare There is no means of quantifying the variation between sets of features Pollution Climate change Shipping Dissolved O2 Acidity Chlorophyll Dimension 2 invariant Water depth variant Sample Depth Salinity UV Temperature Phospahte Nitrate Silicate App. O2 util. Dimension 1
Protein Families and Environmental Features Network (PEN) Distance: Dot product between 1st and 2nd Dimension of CCA
Protein Families and Environmental Features Network (PEN) COG0598, Magnesium Transporter COG1176, Polyamine Transporter “Bi-modules”: groups of environmental features and membrane proteins families that are associated UV, dissolved oxygen, apparent oxygen utilization, sample depth, and water depth are not in the network
Bi-module 1: Phosphate/Phosphate Transporters Low Phosphate, high affinity phosphate transporters which are induced during phosphate limitation High Phosphate, low affinity inorganic phosphateion transporter which are constitutively expressed
Microbes modulate content in response to phosphate Martiny et al. Env Microbiology, 2009 Van Mooy et al. Nature, 2009 Phosphate Concentration related to phosphate acquisition genes in Prochlorococcus Microbes modulate phospholipid content in response to phosphate concentrations
Bi-module 2: Iron Transporters/Pollution/Shipping Negative relationship between areas of high ocean-based pollution and shipping and transporters involved in the uptake of iron Pollution and Shipping may be a proxy for iron concentrations
Bi-module 2: Iron Transporters/Pollution/Shipping • Iron is usually limiting in oceans: High Nitrate-Nutrient/Low Chlorophyll regions • Delivery of iron to is usually by: • terrestrial input • - fluvial (rivers) input • - upwelling from the ocean floor • - aeolian dust from land Rigwell A. J. (2002) Phil. Trans. R. Soc. Lond.
Bi-module 2: Iron Transporters/Pollution/Shipping • Pollution and Dust N/C and Iron Transporters • Negative correlation between COG4558 and COG0609 and dust/pollution values (p-value <0.01) • - Searching the BRENDA database for enzymes using iron as a cofactor reveal that an increase in these two COGs negatively correlated to the amount of enzymes present that required iron.
Conclusions New method (PEN) to visualize complex relationships in metagenomic data using explicit environmental variables We show both known and intuitive relationships between features and genomic content CCA also reveals the invariant fraction of environmental features and protein families (highlights important cellular processes): Chloride Channel, Type II secretion Proteins (virulence) Many variant ABC-type transporters(34/41): suggests streamlining for optimization and energy conservation
Much of Membrane Protein Space Remains Uncharacterized • 15% of predicted membrane proteins had NO homology to Genbank (e-value<1e-10) • We used short motifs (PROSITE) to characterize a small fraction of these including ABC Transporters, GPCRs, Lipocalins, beta-lactamases 16% (29,384) were annotated
Intraribotype diversity and the definition of a ‘species’ 16S analysis of GOS data reveals that most sequences fall into 5 ribotypes However, there were very few identical sequences, suggesting that no two cells have identical genome sequences Eugene V Koonin Nat Biotechnology, 2007 This suggests that ocean microbes are rather adaptive to their environments We observe diversity in membrane protein content and abundance, and show that it is a reflection of different environmental conditions more than phylogenetic diversity (16S) These are mostly oligotrophic (nutrient poor) waters and environmental conditions have likely been fairly constant over many years , genomes are “streamlining”
Conclusions Genotypic variation within similar natural populations occurs in response to environmental conditions Integration of geospatial data can highlight unexpected trends as anthropogenic factors seem to be reflected in microbial function Microbes from ocean surface samples show diversity in membrane protein content Diversity in membrane proteins was shown to be a reflection of different environmental conditions more than phylogenetic diversity Integration of Environmental Features using GPS coordinates Environmental clusters show differences in membrane protein content which reflect environmental conditions (pollution/efflux proteins) Developed (PEN) and adapted techniques to connect features of environment to specific protein families
Acknowledgements Advisors: Donald Engelman and Mark Gerstein Collaborators Gerstein Lab: Tara Gianoulis Kevin Yip Rob Bjornson Nicolas Carriero Philip Kim Jan Korbel Sam Flores Engelman Lab: Damien Thevenin Julia Rogers Past and Present members of Engelman and Gerstein Labs Committee Members: Jim Bowie (UCLA) Annette Molinaro Lynne Regan Mike Snyder Administrative Staff: Mary Backer Ann Nicotra Nessie Stewart Yale Map Collection: Stacey Maples Yale University Biomedical High Performance Computing Facility NIH grant RR19895 which funded the instrumentation