Download
1 / 19
620 likes | 1.46k Vues
PUNE UNIVERSITY, PUNE(M.S .). AAEMF’s COLLEGE OF ENGINEERING AND MANAGEMENT STUDIES A Presentation on. ‘ Glaucoma Detection In Retinal Images Using Automated Method ’. PRESENTED BY GUIDED BY

E N D
PUNE UNIVERSITY, PUNE(M.S.) AAEMF’s COLLEGE OF ENGINEERING AND MANAGEMENT STUDIES A Presentation on ‘ Glaucoma Detection In Retinal Images Using Automated Method ’ PRESENTED BY GUIDED BY Ms. Tanveer AhmedProf. Mr. XYZ Ms. Shaikh KhanGuide Mr. NiteshChaudhary
Table of Contents 1. INTRODUCTION 1.1 CONCEPT OF THE PROJECT 1.2 NEED OF AUTOMATED GLAUCOMA DETECTION 1.3 INTRODUCTION 2.SYSTEM DESCRIPTION 3.1 BLOCK DIAGRAM 3.2 BLOCK DIAGRAM DESCRIPTION 3.3 SOFTWARE PLATFORM 3.4 STEPS OF RECOGNITION 3.5 SYSTEM RESULTS 3.4 PERFORMANCE PARMETERS OF SYSTEM 3. FUTURE SCOPE 4. APPLICATIONS
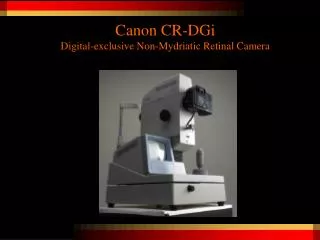
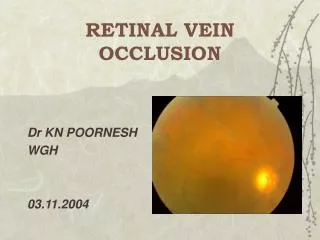
Concept of the project • Aim of our project is to reduce the process time of glaucoma detection. • The project detects the presence of glaucoma by using the color fundus image through the computer screening. • In automated method the input image of a person is captured by fundus camera. • The captured image is subjected to various pre-processing steps like gray level transformation, median filtering, and mathematical morphology. • Image processing capabilities of Matlab are used extensively to accurately detect presence of Glaucoma in the eye.
Need of Automated Glaucoma Detection • A diagnosis of glaucoma requires that there be optic nerve damage or a strong suggestion of damage, which can be clearly seen during a dilated eye examination of the optic nerve. • In general, the hallmark sign of this condition is a loss of peripheral vision. • In existing method the optic cup and optic disc are segmented by creating mask manually and glaucoma is detected. • But its experimental result doesn’t close to clinical CDR value and also the process time is high. • The focus of this project to detect Glaucoma with exact CDR value to clinical examination results and reduce the process time
INTRODUCTION • Glaucoma is an eye disease caused by elevated intra-ocular pressure. • This elevated pressure destroys the optic nerve. This causes • enlargement (or) deepening of optic cup and loss of vision. • In our project Glaucoma will be detected by extraction of optic cup • (OC) and optic disc (OD) i.e. no of pixels present in the optic disc • and optic cup are calculated • We automatically extract the optic disc in retinal images by pixel • based segmentation and optic cup by mathematical morphology • and watershed transformation • In proposed system watershed segmentation easily isolate the • OD and OC boundary. • Then optic cup to optic disc ratio is calculated, to show the • progression of glaucoma
Block diagram description Color fundus image (CFI), that is captured by using fundus camera. The Greyscaletransferred image form the RGB retinal fundus image. Median filtering is applied for removal of salt and pepper noise and image smoothening.
Block diagram description • Histogram of image shows the intensity variations in the retinal fundus images. • We use intensity value to set the threshold. • Here local threshold T=245. • So we can easily extract the optic disc boundary.
Block diagram description Pixel based segmented optic disc Reconstructed color fundus Greyscaleimage by morpholological operation such as dilation, erosion, opening and closing, Here blood vessels are removed Median filtered image
Block diagram description Segmentation result of optic cup. the optic cup is segmented by mathematical morphology and watershed transform. Median filtering image again main purpose of this is to predict the optic cup and optic disc boundaries. Morphological gradient output. It is the difference between the dilation and erosion. We can easily identify the optic cup boundaries
Block diagram description From the output obtained, we can able to infer that the optic cup to optic disc ratio not exceeds 0.3 in automated method. Hence, it is proved that the patient is not affected by glaucoma
Software platform • Matlab R2010b • Matlab R2010b provides variety of options for image processing that enable us to extract the required features and information from the images. • It can also be used to design userfriendly Graphical User Interface to • view results of each process and to provide final statement. • The software can be used to detect the early stages of glaucoma.
Steps (Algorithm) • Algorithm For optic disc Extraction STEP 1: Retinal input color fundus image is captured by CFI camera STEP 2: The color image was converted to gray scale image STEP 3: Apply median filtering for Image blurring and removing of impulse noise STEP4: The histogram of the gray scale image was founded STEP 5: Select the threshold value from the histogram. STEP 6: The pixel based segmentation is done by selected threshold value as STEP 7: The optic disc area is calculated by counting the number of pixels present in the optic disc.
Steps (Algorithm) • Algorithm For Optical Cup Extraction STEP 1: Morphological operation such as Dilation and Erosion are applied on input image for removing blood vessels. STEP 2: Apply Morphological gradient operation that highlights the gray level transition in the input image. STEP 3: Apply median filtering for Image smoothening and removing of impulse noise STEP 4: Apply watershed segmentation for making watershed lines. STEP 5: The optic disc area is calculated by counting the number of pixels presented in the optic cup. STEP 6: Finally the CDR is calculated by dividing the number of pixels in the optic cup by number of pixels in the optic disc.
Expected results • In this novel method, the obtained result show that the CDR value is very closer to the clinical results in terms of accuracy and thus have reduced the time for extracting the optic cup and optic disc. • The GUI should be informative and must be self explanatory • The software must be portable to other PC’s
Performance parameters • Latency : No latency is observed and the detection is fluid and smooth • Authenticity : Authenticity of detection is expected to be 90 % keeping in mind the image processing using Matlab. • Security : Security can be tackled by using the testers ID and patient details to be entered at the start of process. • Power Dissipation : Power dissipation of the system is high as PC might always be needed to perform the complex Image Processing Tasks.
Future Scope • The Detection of Glaucoma is based on only the Optic Cup to Disc ratio measurement. • In future, the other parameters such as neuroretinal rim width, neuroretinal area, vertical cup-disc ratio can also be calculated to indicate the progressive enlargement of the cup. • The depth of progression of Glaucoma can be calculated by 3-D reconstruction.
Applications • Prevent blindness by detecting glaucoma in its early stages • Immediate treatment for early-stage, open-angle glaucoma can delay progression of the disease.