Sampling error
Sampling error. Error that occurs in data due to the errors inherent in sampling from a population Population : the group of interest (e.g., all students at UIC) Sample : a subset of the population that is studied (i.e., people in this class) Symbols for making the distinction:

Sampling error
E N D
Presentation Transcript
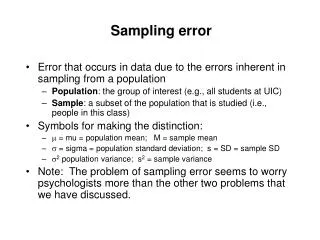
Sampling error • Error that occurs in data due to the errors inherent in sampling from a population • Population: the group of interest (e.g., all students at UIC) • Sample: a subset of the population that is studied (i.e., people in this class) • Symbols for making the distinction: • = mu = population mean; M = sample mean • = sigma = population standard deviation; s = SD = sample SD • 2 population variance; s2 = sample variance • Note: The problem of sampling error seems to worry psychologists more than the other two problems that we have discussed.
Example • Let’s begin with an example: • 21 cards, each with a different score • shuffle cards • draw 5 cards at random • write down the five numbers • pass all 21 cards to the next person • find the average of the 5 scores that you selected
Things to notice about the distribution of sample means from our example 1. The average of these sample means is very close to the population mean 2. There is variation in the sample means 3. The distribution of sample means is normal.
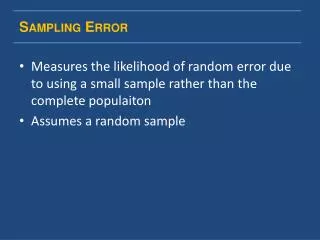
Sampling Error • Sampling error: the difference between the population value of interest (e.g., mean) and the sample value. • Our sample value is often referred to as an estimate of our population value • If the sample is randomly drawn from the population, then sampling error will be random and will be distributed normally
Why does sampling error occur? • Here is the problem: Different samples drawn from the same population can have different properties • When you take a sample from a population, you only have a subset of the population--a piece of what you’re trying to understand S P S S
The problems of sampling error • Sampling error causes two major problems in psychological research 1. Because of sampling error, our sample values might not be equal to the population values. Election example 2. Because of this obfuscation, we can run into a number of difficulties testing in testing scientific hypotheses. ESP experiment example • One of the objectives of inferential statistics is to find ways to quantify the amount of sampling error associated with various statistics
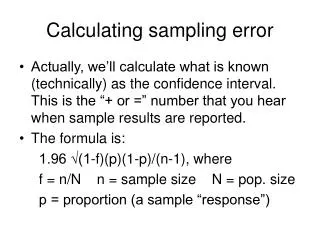
How Can We Quantify Sampling Error? • We begin by noting that, like any kind of “error” we’ve discussed up to this point, we can define it as the difference between two things. • In this example, we’re working with the difference between the sample mean and the population mean • ( - M) = amount of sampling error for any one sample
Quantifying Sampling Error • How much sampling error should we expect in any one situation? • One way to answer this question is to study the distribution of sample means that would be observed under known population values and known sampling conditions. • Forward inference: Making an inference about what sample statistics will be observed based on certain facts about the sampling process and the population.
Quantifying Sampling Error • “Known population values” • = 10 • = 6.05 • “Known sampling conditions” • Random sampling (every case in the population has an equal opportunity for being selected for the sample) • Sample size of 5 • Example: During the last demonstration, we studied the sample means observed when we took random samples of size 5 from a population in which the mean was 10.
14 15 4 0 20 9 Population of scores = 10.00 and = 6.05 Sample of 5 scores drawn randomly from the population M = 11.6 and SD = 6.78 Add cards to deck and sample again
14 15 4 0 20 9 • Take the mean of each sample and set it aside • 11.6 • 11 • 9.2 • 12.4 • 11.8 • 6.8 • 12 • 10.2 • 13.2 • 9.4 The distribution of these sample means can be used to quantify sampling error
Sampling Distributions • By simulating the process of drawing random samples of size N from a population with a specific mean and variance, we can learn • (a) how much error we can expect on average and • (b) how much variation there will be on average in the errors observed • Sampling distribution: the distribution of a sample statistic (e.g., a mean) when sampled under known sampling conditions from a known population.
n = 2 mean of sample means = 10 SD of sample means = 4.16 n = 5 mean of sample means = 10 SD of sample means = 2.41 n = 15 mean of sample means = 10 SD of sample means = 0.87