Download
1 / 17
170 likes | 269 Vues
Explore the significance of the sampling distribution in statistics, from theory to practical applications, including the Central Limit Theorem (CLT) and standard error estimation. Discover the bridge between sample and population statistics. Learn the impact of sample size on bias and variance.

E N D
Sampling distribution of the means and standard error Chong Ho Yu, Ph.D.
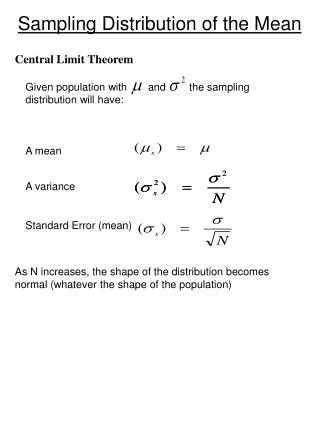
Sample of samples • The sampling distribution • We draw a sample from the population. • Obtain the mean and then put the sample back. • Do it again and again, then we have the sampling distribution of the sample means. • In theory we can repeat the process forever. The two tails of the sample distribution curve should never touch down.
The bridge • The sampling distribution is the bridge between the sample and the population, or between the descriptive statistics and the inferential statistics. • CLT states that a sampling distribution becomes closer to normality as the sample size increases, regardless of the shape of distribution. • CLT is central to large sample statistical inference and is true by limitation--it is true given that the sampling distribution is infinite. • We can simulate it in Excel.
Hypothetical population • The failure to see a hypothetical population as an infinite population leads to another common misconception: Sample size determination is viewed as being based upon the ratio between the sample and the population.
Questionable statements concerning the CLT and normal distribution could be found in statistics texts. For example, a statistical guide for medical researchers stated, "sample values should be compatible with the population (which they represent) having a normal distribution." (Airman & Bland, 1995, p.298).
Because the shape of the population distribution is unknown and could be non-normal, in parametric tests data normality resembles the sampling distribution, not the population. In other words, a test statistic from the sample will be compared against the sampling distribution
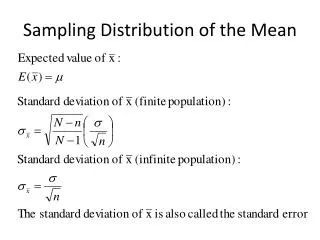
Standard error • Why is it called “standard error”? Bias in estimation (off the target). • The sample statistics is the estimator of the population parameter (ideally, unbiased). • The standard error of the statistics is the standard deviation of those sample statistics over all possible samples drawn from the population (like repeated sampling in sampling distributions).
Standard error • The SE of small samples tend to systematically underestimate the population. • The question is not whether the estimation is totally bias-free. Rather, it is about how much bias? Standard error tells us how much bias.
What would James Bond do to save his girlfriend? • In the movie “Skyfall,” the bad guy put a glass of wine on top of his girlfriend’s head, and forced James Bond to shoot the glass off her head.
What would James Bond do to save his girlfriend? • Mr. Bond could shoot many times and hopefully one of the bullets could hit the target (high variance approach), but one of the bullets might kill the girl, too. • Alternatively, he could focus and make one best shot only (unbiased approach), but he might miss the target. • If you were 007, what would you do?
Possible scenarios • Which one is the ideal? • We don’t know the population mean and variance, and thus we estimate the standard error. • As sample size increases, SE approaches 0. • The mean of the sampling distribution of the means approaches the population mean, and we can get an unbiased estimate of the population.
We want to reduce bias! • We don’t know the population mean and variance, and thus we estimate the standard error. • As sample size increases, SE approaches 0. • The mean of the sampling distribution of the means approaches the population mean, and we can get an unbiased estimate of the population.
Take home message: Take n into account • We must take the sample size into account for a better estimate. • S=sample SD • N= sample size