Introduction to Dot Plots
Introduction to Dot Plots. There are two types of data we will be looking at. Categorical Data - places someone or something into several groups or categories. For example: favorite color, job titles, names of students, etc.


Introduction to Dot Plots
E N D
Presentation Transcript
There are two types of data we will be looking at • Categorical Data - places someone or something into several groups or categories. For example: favorite color, job titles, names of students, etc. • Quantitative Data - measures numerical values. For example: age, height, number of siblings, etc.
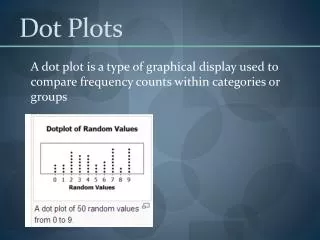
There are many ways to analyze a set of data. A set of data is…
Not only do we want to compare differences in data between different sets of data (for example, between men and women) but also at how much variation there is in the data within each group.
The pattern of variability within a set of a data is called the distribution.