Understanding Dot Plots for Data Visualization
Dot plots are effective tools for recording and visualizing data. In this example, we count the number of raisins in boxes from a bulk packet, resulting in the values 64, 65, 55, 64, 65, 67, 61, 61, 65, 64, 63, 65, and 65. The horizontal axis represents these values, while the frequency is shown by the number of dots in each column. Upon constructing the dot plot, we observe that the data distribution is asymmetrical, with a primary cluster around the values 63-65, while 55 appears to be an outlier. Refer to workbook page 236, Exercise D for practice.

Understanding Dot Plots for Data Visualization
E N D
Presentation Transcript
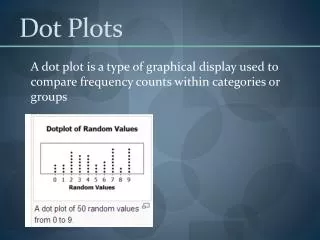
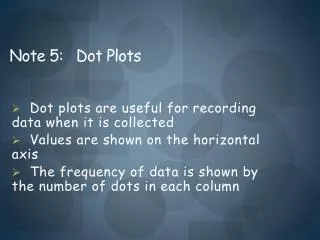
Dot plots are useful for recording data when it is collected Values are shown on the horizontal axis The frequency of data is shown by the number of dots in each column Note 5: Dot Plots
Example: The number of raisins were counted in boxes from a bulk packet of raisins. 64 65 55 64 65 67 61 61 65 64 63 65 65 Draw a dot plot and comment on the distribution of the data The distribution of the data is asymmetrical There is one main cluster of data – number of raisins 63-65 55 raisins seems to be an outlier
Work Book Page 236 Exercise D