Download
1 / 25
370 likes | 1.42k Vues
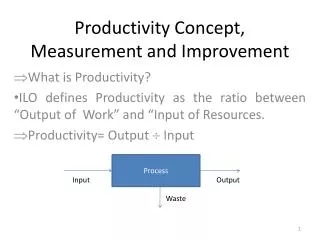
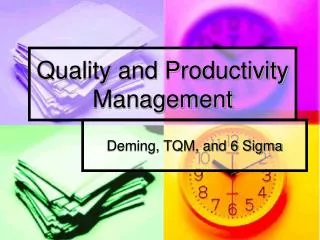
Quality and Productivity Improvement. Check Do Act Plan. Quality level. Time. Learning Objectives. Identify the stage of competitiveness for a service firm. Discuss the analogous roles of inventory and queuing. Perform a Walk-Through-Audit.

E N D
Quality and Productivity Improvement Check Do Act Plan Quality level Time
Learning Objectives • Identify the stage of competitiveness for a service firm. • Discuss the analogous roles of inventory and queuing. • Perform a Walk-Through-Audit. • Lead a Plan-Do-Check-Act (PDCA) process improvement initiative. • Use quality tools for analysis and problem solving. • Discuss the corporate programs for quality improvement. • Conduct a data envelopment analysis (DEA).
Four Stages in Service Firm Competitiveness 1. Available for service 2. Journeyman 3. Distinctive competence 4. World-class service delivery Customers patronize service Customers neither seek Customers seek out the firm The company’s name is synonymous firm for reasons other than out nor avoid the firm. on the basis of its sustained with service excellence. Its service performance. reputation for meeting doesn’t just satisfy customers; it customer expectations delights them and thereby expands customer expectations to levels its competitors are unable to fulfill. Operations is reactive, Operations functions in a Operations continually excels, Operations is a quick learner and fast at best. mediocre, uninspired reinforced by personnel innovator; it masters every step of the fashion. management and systems service delivery process and provides that support an intense capabilities that are superior to customer focus. competitors. SERVICE QUALITY Is subsidiary to cost, Meets some customer Exceeds customer Raises customer expectations and highly variable. expectations; consistent expectations; consistent seeks challenge; improves on one or two key on multiple dimensions. continuously. dimensions.
Four Stages in Service Firm Competitiveness (cont.) 1. Available for service 2. Journeyman 3. Distinctive competence 4. World-class service delivery BACK OFFICE Counting room. Contributes to service, plays Is equally valued with front Is proactive, develops its own an important role in the total office; plays integral role. capabilities, and generates service, is given attention, opportunities. but is still a separate role. CUSTOMER Unspecified, to be A market segment whose A collection of individuals A source of stimulation, ideas, satisfied at minimum cost. basic needs are understood. whose variation in needs is and opportunity. understood. INTRODUCTION OF NEW TECHNOLOGY When necessary for When justified by cost When promises to enhance Source of first-mover advantages, survival, under duress. savings. service. creating ability to do things your competitors can’t do. WORKFORCE Negative constraint. Efficient resource; disciplined; Permitted to select among Innovative; creates procedures. follows procedures. alternative procedures. FRONT-LINE MANAGEMENT Controls workers. Controls the process. Listens to customers; coaches Is listened to by top management and facilitates workers. as a source of new ideas. Mentors works to enhance their career.
Continual Improvement as a Competitive Strategy • Analogy with Just-in-Time Manufacturing • Inventory and Waiting Line Analogy • Continual Improvement as a Service Organization Culture • Management Implications
Inventory and Waiting Line Analogy Feature Inventory Waiting line Costs Opportunity cost of capital Opportunity cost of time Space Warehouse Waiting area Quality Poor quality hidden Negative impression Decoupling Promotes independence of Allow division of labor and production stages specialization Utilization Work in process keeps machines busy Waiting customers keep servers busy Coordination Detailed scheduling not necessary Avoids matching supply and demand
Traditional vs World-Class Service Organizations Dimension Traditional World-class System assumption Closed system Open system Job design premise Division of labor Flexibility Structure Rigid Fluid Relation to others Individual Team player Employee orientation Task Customer Management Supervisor Coach and facilitator Technology Replace human effort Assist service delivery Information Efficiency Effectiveness
Walk-Through-Audit • Service delivery system should conform to customer expectations. • Customer impression of service influenced by use of all senses. • Service managers lose sensitivity due to familiarity. • Need detailed service audit from a customer’s perspective.
Quality and Productivity Improvement Process • Foundations of Continuous Improvement - Customer Satisfaction - Management by Facts - Respect for People • Plan-Do-Check-Act (PDCA) Cycle • Problem Solving (10 steps)
Quality Tools • Check Sheet • Run Chart • Histogram • Pareto Chart • Flowchart • Cause-and-Effect Diagram • Scatter Diagram • Control Chart
Check Sheet Month Lost Departure Mechanical Overbooked Other Luggage Delay January 1 2 3 3 1 February 3 3 0 1 0 March 2 5 3 2 3 April 5 4 4 0 2 May 4 7 2 3 0 June 3 8 1 1 1 July 6 6 3 0 2 August 7 9 0 3 0 September 4 7 3 0 2 October 3 11 2 3 0 November 2 10 1 0 0 December 4 12 2 0 1 Total 44 84 24 16 12
Cause-and-Effect Chart for Flight Departure Delay (Fishbone Chart) Equipment Personnel • Gate agents cannot process passengers quickly enough Too few agents Aircraft late to gate Agents undertrained Late arrival Agents undermotivated Gate occupied Agents arrive at gate late Other Mechanical failures Late cabin cleaners Late pushback tug Weather Late or unavailable cabin crews Air traffic Late or unavailable cockpit crews Delayed Flight Departure Poor announcement of departures Weight and balance sheet late Delayed checkin procedure Late baggage to aircraft Confused seat selection Late fuel Passengers bypass checkin counter Late food service Checking oversize baggage Issuance of boarding pass Acceptance of late passengers Cutoff too close to departure time Desire to protect late passengers Material Desire to help company’s income Poor gate locations Procedure
Control Chart of Departure Delays expected Lower Control Limit 1998 1999
CorporatePrograms for Quality Improvement • Marriott Personnel Programs • Zero Defects (Crosby) • Deming’s 14 Point Program • Malcolm Baldrige Quality Award • ISO 9000 • Benchmarking
Topics for Discussion • Could firms in the “world-class service delivery” stage of competitiveness be described as “learning organizations?” • Contrast the philosophies of “continuous improvement” and “process reengineering.” Is there a role for both points of view in services? • Compare the philosophies of Deming (i.e 14-point) and Crosby (i.e. Zero Defects). • What are the limitations of “benchmarking?”
The Museum of Art and Design • Critique the WtA gap analysis. Awareness of Exhibits Information Experience Visitor Habits Facilities Language • Could there be other explanations for the gaps?
The Museum of Art and Design • Make recommendations for closing the gaps found in the WtA. • How can the servicescape help in self-selecting customers and employees?
Mega Bytes Restaurant • How is the Seven-Step Method (SSM) different from Deming’s PDCA cycle? • Prepare a cause-and-effect or fishbone diagram for a problem such as “Why customers have long waits for coffee.” Use Figure 18.17 as a guide. • How would you resolve the difficulties that study teams have experienced when applying the SSM?
The Seven-Step Method • Step 1: Define the project • Step 2: Study the current situation • Step 3: Analyze the potential causes • Step 4: Implement a solution • Step 5: Check the results • Step 6: Standardize the improvement • Step 7: Establish future plans