Soil Test Interpretation
Soil Test Interpretation. Rhonda Janke Hort 560. A few observations about soil…. Soil biological test interpretation. The “let it rot” test More soil biological activity results in faster rate of decomposition of cellulose material (paper, cloth, wood, etc.)

Soil Test Interpretation
E N D
Presentation Transcript
Soil Test Interpretation Rhonda Janke Hort 560
Soil biological test interpretation • The “let it rot” test • More soil biological activity results in faster rate of decomposition of cellulose material (paper, cloth, wood, etc.) • In general, soil microbial diversity and abundance is a good thing. • Detailed fungal and bacterial counts can be performed by professional labs, but the results may not be very repeatable. Also expensive.
“The Solvita® soil-life test kit provides an important new tool for gardeners, farmers and scientists to evaluate soil microbial respiration rate in an efficient and cost-effective manner. Soil respiration is an important aspect of soil quality and a good indicator of soil fertility.” • “The Solvita test enables you to: • estimate annual nitrogen release based on soil biological activity • evaluate organic matter sufficiency of soils • make overall judgements to fit into "soil quality" interpretation • achieve accuracy comparable to and less expensive than Dräger tubes”
Soil Respiration Rate –the reality • More CO2 (carbon dioxide) coming off the soil means the soil is respiring (breathing) more. This indicates either a high rate of respiration of existing organisms, or high numbers, or both. • Having more organisms is a good thing, but a high respiration rate also means your soil system is burning off carbon…which lowers your organic matter levels, which is a bad thing. • High respiration rate is a result of optimal temperatures, moisture, and aeration, sometimes as a result of tillage.
Q: How much E. coli is allowed?A: None, if it is drinking water. Drinking water GH with Parsley Composting Area Livestock Water
The E. coli (fecal coliform) test. • The presence of E. coli in a sample of soil or on the surface of a crop to be sold indicates some fecal material contamination from humans or animals. • If found, it would be wise to do a step by step evaluation of your system and try to eliminate the cause. • This includes checking your wash water source, training workers (and self) to use good handling practices, keep animals out of veg. growing area, compost manure, etc….
Soil physical properties • Texture • Macro-organic matter • Water stable aggregates • Infiltration rate (lab & field) • Bulk density • Water holding capacity
Soil Texture • Calculate % sand, silt, and clay using visual gravitational method or hydrometer method. • Use the soil texture triangle to determine exact soil texture classification. (loamy sand vs. sandy loam, etc.) • Learn more about your soil type from the NRCS soil series descriptions. • Most soil texture types can be improved by adding organic matter. Few to none can be improved by adding sand (common misconception).
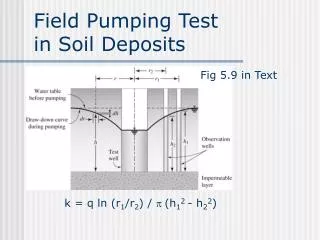
Infiltration rate • Can determine in the lab using a filter paper and funnel. • Determine in the field with a coffee can or piece of pipe and a jug of water. • Poor infiltration rate (surface) can result in all kinds of problems, from ponding, crusting, etc. • Poor infiltration rate in the sub-soil can also cause problems, poor root aeration and growth. Can determine by digging a hole, and doing a test similar to a “perc” test performed when putting in a septic tank.
Four Ways to Improve Infiltration: • Adding organic matter • Adding organic matter • Adding organic matter • Don’t work the soil when wet!!!
Soil compaction and bulk density • Detailed discussion beyond the scope of this lecture, but avoiding compaction is important! • Can test by measuring the “bulk density” of the soil, or the dry weight of the soil as a ratio of the volume of the soil as found in the field (not fluffed up). • Other tests include penetrometer devices, a simple “tile probe,” the “shovel” method, or simply trying to get a soil sample from a field during a dry spell.
Soluble Salt (EC) Interpretation • See handout from this week’s lab • 0-1 mmhos/cm generally considered safe • 1-2 mmhos/cm safe for some plants, or in some potting mixes when use lots of water • 2-4 mmhos/cm getting risky, chance of burn on sensitive plants. • Salts a problem in some irrigation waters, or heavily fertilized plots with drip irrigation and no rainfall or overhead water to leach it into the soil.
Nutrient levels – a story about Goldilocks and the three bears…..
Interpretation of chemical tests • How much is “just right?” • How do you know if there is not enough? • When is there too much?
Understanding pH • (chart of nutr. Avail. Here)
How to adjust soil pH • Add liming products to raise pH. See various sources in publications. Not commonly needed in KS unless using fertilizers that acidify the soil. • Add sulfur to lower pH. Ammonium sulfate works fastest, but elemental sulfur allowed by organic standards. See sheets for rates. • Soils with high exchange capacity (CEC) will require more product to change the pH.
Three reasons to not have soil nutrient levels in the “excessive” range: • 1) Contributes to down-stream pollution. Can leach into ground water, run-off into surface water, or both. • 2) Too much of one nutrient can cause others to be less available. For example, too much phosphorus may induce deficiency of zinc, copper, and/or nitrogen. Also, calcium, magnesium, and potassium compete for the same exchange sites. • 3) Save money by not applying fertilizer that you don’t need.
Farms being asked to cooperate are within the Mississippi River watershed, which includes 31 states that cover about 40 percent of the country.
Hypoxia - The dead zone, a 6,000-square-mile area in the Gulf of Mexico that is almost totally devoid of life, persists despite conservationists’ ongoing efforts to rein it in. First mapped in the mid-1980s, the zone is caused by nitrogen fertilizer runoff, which flows from inland farms down the Mississippi River and into the gulf. Nitrogen causes huge summer algal blooms that decompose and sink to the bottom, where bacteria feast on them and, in the process, suck vital oxygen from the seawater. Courtesy of SEAWiFS/NASA/ GSFC/Orbimage Brownish water from the Mississippi River billows into the Gulf of Mexico in this 2000 image.
Ways to detect nutrient deficiencies • Visual symptoms; use your crop as a bioassay. This could be costly if levels are too low. • Tissue testing. This more common with perennial crops, large scale cropping. Requires standardized controls with known developmental age/stage, certain plant part (e.g. “petiole of the 4th leaf from the growing tip,” or “midrib of 1st leaf above the primary ear.” [see Knott’s Handbook for more] • Soil test.
Nitrogen deficiency symptoms(poor growth, yellow OLDER leaves) Celery Plant: Growth dwarfed; foliage pale green and older leaves yellow and die early. Carrot: Growth dwarfed and thin; leaves pale green and older leaves yellow and red tints and die off early. Tomato: Growth dwarfed, thin and upright habit; stem and petioles rigid; leaves pale green, occasional purplish tints, older leaves yellowing. from The Diagnosis of Mineral Deficiencies in Plants by Visual Symptoms by Thomas Wallace, M.C., D.Sc., A.I.C. Published by His Majesty's Stationary Office — 1943
Phosphorus deficiency symptoms(poor root growth, purple color) Growth stunted; leaves lustreless green and dull purple tints. Leaves strong purple tints. Growth dwarfed and thin; leaflets droop, curl backward and develop strong, dull purple tints. from The Diagnosis of Mineral Deficiencies in Plants by Visual Symptoms by Thomas Wallace, M.C., D.Sc., A.I.C. Published by His Majesty's Stationary Office — 1943
Potassium deficiency(burning at leaf edges, don’t confuse with insect damage) Internodes short, leaves relatively long; marginal and tip browning of leaves. Leaflets slight marginal and intervenal chlorosis followed by brown marginal scorching; scorched margins curled foward. Intervenal chlorosis near margins followed by marginal scorch.
Calcium deficiency(youngest leaves show deficiency, opposite of N effect) • Dying back of trusses and "Blossom End Wilt" of distal fruitlets Dying off of terminal leaflets and flowers; leaves purplish brown tinting. Dying off of terminal leaflets and flowers; leaves purplish brown tinting.
When looking at plant symptoms, remember that: • Symptoms indicate lack of plant availability or uptake of the nutrient. • This could be due to low levels in the soil, OR…. • Root system of the plant is stunted. This could be due to soil compaction, poor aeration/flooding, not enough irrigation, or other reason. Look at the roots. • Blossom end rot in tomatoes in KS often occurs with the first fruit, before the roots are fully developed. (Marr, pers. comm.) • Mycorhizae can improve root function.
Soil Tests – the art and the science Action Representative sample collection Late spring nitrate test sample handling, drying…. Manure and compost credits Cropping history and legume credits Lab accuracy, differences of methods. Organic matter levels Interpretation of the lab values – low, medium, high, very high…. Recommendations for fertility amendments Intended crop Previous crop
When looking at soil test results: • Are numbers expressed as elemental (N, P, K) or the oxide? (P2O5 or K20) • Use conversion formula…..[P2O5 x .437=P] [K20 x .830 = K] • Are numbers expressed as ppm, or lb per acre (parts per 2 million) • Use conversion formula…..(multiply or divide by 2) • Depth of soil sample makes a difference. Was the sample collected at the top 2 inches, 6 inches, 12 inches, etc..?
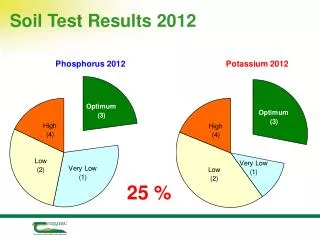
Convert the numbers to low, medium, or high category for interpretation. • Field extensive crop recommendations generally use lower numbers in each category than tables for high value crops. • Reasons: some field crops require less fertilizer than vegetables. • Also the cost of fertilizer relative to the value of the field crop is relatively expensive, the cost of fertilizer for a high value (vegetable) crop is lower, especially as compared to other costs such as labor.
Comparison of Horticultural and Agronomic soil nutrient level interpretations. “Kansas Garden Guide”KSU Dept. Horticulture. N value from “Building Soils.” P & K from KSU Dept. of Agron. MF 2586. Note: these values may also differ due to region of the country, soil texture, and organic matter content.
Several options for fertilizer recommendations include: • Replacement – calculate anticipated needs of crop (in lb/A) and apply that level (minus soil test level). Allow for fertilizer use efficiency of only 50%, and also 25 to 50% from organic sources in application year. • Sufficiency– based on previous research, estimate average fertilizer amount to achieve 90 to 95% of maximum yield. Little consideration of future nutrient levels. • Build-maintenance – attempt to minimize the probability of P or K limiting crop yield, and also build soil test levels over a 4 to 8 year period. • FBTSOYP – common method, observe plants, and track soil test levels periodically.
How to calculate: • Replacement - determine needs of crop, levels in soil, levels in soil amendments (fertilizers) and do the math. • Sufficiency– Send sample to KSU lab, request “corn” as a crop, and wait for results, OR see excel program at www.oznet.ksu.edu/agronomy/SoilTesting/ • Build-maintenance – Same as above. • FBTSOYP – not the most precise method, but adequate for the home garden. Observe plants and track soil test levels periodically.
Organic Sources Cow manure .5-1.5% Horse manure 0.6 % Chicken manure 1-3% Sheep 3-4% Alfalfa hay 2.5 % Blood meal 13% Soybean meal 7% Fish meal 10% Vetch 3.1% Fertilizers Ammonium nitrate 33% Anhydrous ammonia 82% Ammonium sulfate 21% Potassium nitrate 13% Urea 46% Fertility Amendment Options- Nitrogen (N)
Organic Sources Cow manure .7-1.6% Horse manure .7-1.2 % Chicken manure 4.5-6.0% Sheep 1.2-1.6 Alfalfa hay 0.5 % Blood meal 2% Soybean meal 1.2% Fish meal 6% Vetch 3.1% Bone meal 15% Fertilizers Phosphoric acid 54% Superphosphate 20% Concentrated superphosphate 46% Rock phosphate 30% (but availability very low) Colloidal phosphate 22% (availability low, but better than rock) Note: Rock and colloidal sources allowed in organic production. Fertility Amendment Options- Phosphorus (P2O5)
Organic Sources Cow manure 2.4-3.6% Horse manure 1.2-2.2 % Chicken manure 1.2-2.4% Sheep 3-4% Alfalfa hay 2.5 % Blood meal 1% Soybean meal 1.5% Vetch 2.5% Wood ash 5-7% Greensand 5% (low availability) Fertilizers Potassium nitrate 44% Potassium chloride 62% Potassium sulfate 53% (allowed in organic production if mined and not refined) Fertility Amendment Options- Potassium (K20)
Organic Sources Can be bulky, best if locally available. Sometimes less expensive, sometimes more expensive Most contribute to organic matter pool and long-term fertility Best to wait at least 90 to 120 after “raw” manure application to harvest food crops. Fertilizers Convenient, available for purchase. Soluble, plant available Many contribute to the “salt index” of the soil, and also most lower the pH (see Knott’s handbook for details) Fertility Amendment Options-Pros and Cons
Fertilizer recommendations for ONIONS for several states (ave. applied for California data) * *Amounts expressed as lb/A of N, P2O5 or K20.
Soil Tests – the art and the science Action Representative sample collection Late spring nitrate test sample handling, drying…. Manure and compost credits Cropping history and legume credits Lab accuracy, differences of methods. Organic matter levels Interpretation of the lab values – low, medium, high, very high…. Recommendations for fertility amendments Intended crop Previous crop
Assume: Soil N test was “low” or 5 ppm N. Use the replacement value of 145 lb/A Previous crop was clover, so take about 40 lb/N credits. Need to add 100 lb N/A Options: 4000 lb/A (2T) alfalfa hay x 2.5% N = 100 lb Bed size is 4’x100’, or .009 A x 4000 lb = 37 lb/bed (1 bale). Ammonium nitrate could be applied at 303 lb/A x 33%=100 lb This amounts to 2.8 lb/bed. Nitrogen Calculations for Onions
Assume: Soil P test was “low”. Use the replacement value of 57 lb/A Options: 11,400 lb/A alfalfa hay x 0.5% N = 57 lb Bed size is 4’x100’, or .009 A x 11,400 lb = 105 lb/bed (~3 bales). Superphosphate could be applied at 285 lb/A x 20%=57 lb This amounts to 2.6 lb/bed. Phosphorus Calculations for Onions
Assume: Soil K test was “medium,” or 150. Use the replacement value of 187 lb/A Need to add 37 lb K/A? Options: 11,400 lb/A alfalfa hay x 2.5% K = 285 lb Bed size is 4’x100’, or .009 A x 11,400 lb = 105 lb/bed (~3 bales). Potassium chloride could be applied at 60 lb/A x 62%=37 lb/A This amounts to 0.33 lb/bed. Potassium Calculations for Onions
Conclusions • Soil test interpretation is an art AND a science. • Much depends on your goals, and approach to farming and soil building. • Using local resources can save money, and help build soil at the same time.