Download
1 / 30
300 likes | 411 Vues
Interpretation and Visualization of Model Test Data for Slope Failure in Liquefying Soil. Bruce L. Kutter Erik J. Malvick R. Kulasingam Ross Boulanger UC DAVIS. US National Science Foundation (Grant Number: CMS-0070111).

E N D
Interpretation and Visualization of Model Test Data for Slope Failure in Liquefying Soil Bruce L. Kutter Erik J. Malvick R. Kulasingam Ross Boulanger UC DAVIS US National Science Foundation (Grant Number: CMS-0070111) US-Japan Workshop on Earthquake Resistant Design of Lifeline Facilities and Countermeasures against Liquefaction
Concepts: Void redistribution – contraction and dilation Example: impermeable layer covering a liquefiable layer • Dilating element: vin > vout • Constant volume element: vin ~ vout • Contracting element: vin < vout
dilatant contractive Flow Localization A C Concept: Phase trasformation line limits the pore pressure build up --- until flow failure occurs
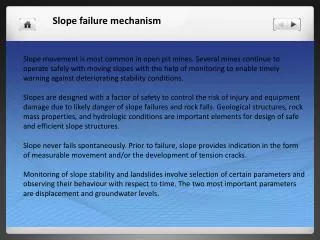
Hypotheses Pore water tends to accumulate at the interface of a relatively impermeable layer that covers a liquefying sand layer. The accumulation permits the saturated soil to dilate in this region and consequently, shear strains may localize near the interface. The localization leads to an increase in the magnitude of deformations, and could lead to flow failure
Before shaking After Motion A After Motion B (Longer duration) Test #2 on the small centrifuge Kulasingam et al.(2001)
Large Centrifuge Model Test EJM01_217
0.38 m model 14 m prototype After 2 Shakes Before
Before After 2 Shakes
Basic Diagram, Accelerometers Grid Square = 10 cm Model Scale
Basic Diagram, Pore Pressure Transducers Grid Square = 10 cm Model Scale
Silt Plane Surface
Procedure to calculate volumetric strains from measured pwp Darcy’s law, based on ue measured in centrifuge hi is the spacing of the sensors; from conservation of volume Volumetric strain rate is proportional to the second derivative of the pore water pressure
Array 4 Array 6 Basic Diagram, Pore Pressure Transducers Grid Square = 10 cm Model Scale
silt Array 4 silt Array 6
Effect of Void Redistribution on Residual Shear Strength (Sr) Seed & Harder (1990) Mechanism B by NRC (1985) - Example of potential void redistribution within a globally undrained sand layer. Seed (1986) argued that Sr values back-calculated from case histories of flow failures implicitly accounted for any effects that void redistribution and/or other factors may or may not have had.
Conclusions • Water tends to flow upward during liquefaction and this water may accumulate in a dilating shear zone beneath an impermeable boundary. • Pore pressures in a dilatant stable slope tend to stabilize such that fmob=33o (~“phase transformation”); limiting ru values depend on the magnitude of shear stress. • Critical combinations of shaking intensity, relative permeabilities, layer thicknesses, and densities determine whether localization will occur. • It is virtually impossible to perform a systematic study of the all parameters affecting void redistribution from field case histories. Model testing is the only way! • The use of even more instrumentation in model tests and automated visualization tools will improve the resolution of detail.
Conclusions (2) • Procedures were developed to improve contour plot by forcing contours to match estimated boundary conditions • Drained boundary: u = 0 • Impermeable boundary: normal hydraulic gradient = 0 • For pore pressure ratio: ru= ru(nearest transducer) • The second derivative of measured pwp distribution was used to calculate volumetric strain rate distribution. Small errors in water pressure measurement can lead to larger errors in the second derivative. Nevertheless, the results seem meaningful. • Visualization and analysis of pore pressure data from a large centrifuge test provides a lot of detail that is difficult to obtain by any other method.
CYCLIC SETTLEMENT AND SLIDING OF SEAWALLS Randolph R. Settgast
Cyclic Load-Deformation Response Parameters • t* » Shear Stress • g* » Shear Strain • S* » Axial (Vertical) Strain • sv* » Effective Stress