Download
1 / 39
390 likes | 511 Vues
CERN, FiDeL meeting, 28 th September 2010. Analysis of June-July measurements. Nicholas Aquilina TE-MSC-MDA Acknowledgements : L. Fiscarelli , G. Montenero , L. Walckiers for measurements L. Bottura , N. Sammut , E. Todesco for fits and model. Contents. List of measurements

E N D
CERN, FiDeL meeting, 28thSeptember 2010 Analysis of June-July measurements Nicholas Aquilina TE-MSC-MDA Acknowledgements: L. Fiscarelli, G. Montenero, L. Walckiers for measurements L. Bottura, N. Sammut, E. Todesco for fits and model
Contents • List of measurements • Decay amplitude vs ramp rate • Scaling laws • Linear correlation • Difference between measurements • Baseline analysis
Decay amplitude vs ramp rate • MB2524 has been the first magnet to be measured at 2 A/s in June-July with FAME • Decay amplitude is expected to increase from 2 A/s to 10 A/s by 50% to 75%
Scaling law (1) • Ramp rate of 10 A/s • Flattop current of 11850 A • Flattop time of 1000 s • Preparation time of 0 s
Scaling law (3) Note that the scaling law is not accurate at low ramp rate values (decay amplitude is factor 2 less, not 5) ∆b3vsdI/dt for 6 kA ramps
Scaling law (4) Note that the scaling law is not accurate at low ramp rate values ∆b5vsdI/dt for 6 kA ramps
Scaling law (5) Note that the scaling law is not accurate at low ramp rate values ∆b3vsdI/dt for 4 kA ramps
Scaling law (6) Note that the scaling law is not accurate at low ramp rate values ∆b5vsdI/dt for 4 kA ramps
Linear correlation (1) • Snapback can be described by an exponential fitting: • Linear correlation:
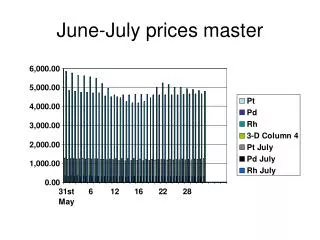
Difference between measurements (1) • Dec 09-Jan 10 measurements were compared with Jun-Jul 10 measurements • Observations: • Change by a factor of 1.5 • Campaign 1 (blue) refers to Dec 09-Jan 10 measurements • Campaign 2 (black) refers to Jun-Jul 10 measurements Comparison of the b3 component for a 6 kA ramp.
Difference between measurements (2) P: 2, 0.05 E: 0, 0 L:10, 2 P:-2, -0.05 P: 2, 0.82 E: 0, 0 L:10, 2 P:-2, -0.82
Baseline (1) • Stop for 0 s at 350 A • Stop for 1000 s at 500 A (pre-injection) • Stop for 1000 s at 757.2 A (injection)
Baseline (4) Decay occurs even when stopping at injection for 0 s. Please note that PELP is changed and restarted when stopping for 0 s.
Baseline (6) Decay occurs even when stopping at injection for 0 s
Baseline (8) Decay occurs even when stopping at injection for 0 s
Baseline (11) • Note how measurements 19, 22 and 23 take a different path then the others • This can be the effect of the fast PELP used to ramp up from 350 A to the next level • Measurements 18 and 20 join these three when using the same PELP • Decay occurs even when stopping at injection for 0 s
Conclusion • Linear correlation has been confirmed once again • The flattop current scaling law has been confirmed • The ramp rate scaling law was extended to a lower value of 2 A/s, and it was found that the decay amplitude was a factor of 2 less, not 5. • PELP values used to go from one plateau to the other (even between the pre-injection and the injection plateau) affects the amount of decay. • This was concluded after comparing two different ramps which were used in two separate measurement campaigns. • Decay also occurs when a stop for 0 s followed by a slow acceleration (restart of PELP) is done.
CERN, FiDeL meeting, 28thSeptember 2010 Analysis of August-September measurements
Aim of the measurements • Difference between using an actual pre-cycle as a pre-cycle and using the previous physics run as a pre-cycle • Effect of ramping up with 2 A/s and ramping down with 10 A/s. • Modifying the PELP
Aim of measurements 1 to 4 • Difference between using an actual pre-cycle and a physics run as a pre-cycle • The effect of ramping up with 2 A/s and down with 10 A/s • End of July, ramp up and ramp down rates of pre-cycle were 10 A/s, ramp up of physics run was 10 A/s and ramp down was 2 A/s
Results of measurements 1 to 4 • No difference between using an actual pre-cycle or a physics run as a pre-cycle (within 20%) • Decay amplitude depends on the ramp down rate (not ramp uprate)
Measurements 4 and 5 • Aim: • Exponential part of the ramp removed (PLP) • Result • No effect on the decay amplitude
Measurements 5 to 7 • Aim • Increasing the P term in the PLP • Result • No difference in the decay amplitude
Measurements 7 and 9 • Aim • Acceleration term in all ramps (except the actual ramp) was increased • Result • Decay amplitude increase by 65%
Measurements 7 and 9 • Result • Different path taken by measurement 9 because of the fast acceleration used