Understanding Weather Measurement and Data Analysis: A Guide to Contouring and Forecasting
This comprehensive guide explores the intricacies of weather measurements and data analysis. It covers key concepts such as the significance of station models, the utility of coordinated universal time in meteorology, and how to accurately contour weather data using isopleths. It details methods to visualize weather patterns through radar and satellite imagery, ensuring accurate forecasting. Practical tips for drawing isopleths and understanding various atmospheric measurements are also included, making this resource valuable for both students and professionals in meteorology.

Understanding Weather Measurement and Data Analysis: A Guide to Contouring and Forecasting
E N D
Presentation Transcript
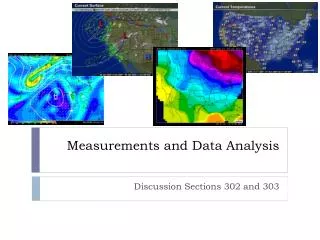
Measurements and Data Analysis Discussion Sections 302 and 303
NCEP NAM Model • Surface/Precip 1200Z • 850 mb/Temp 1200Z • 300 mb/Wind speed 1200Z • 850-800 mb/Relative Humidity 1200Z
Radar/Satellite • Current Radar Loop • Current Satellite Loop • Current Water Vapor Loop
Observations and Measurements • Station models • Observations taken at a particular weather station • Observations are taken simultaneously across the nation several times a day • Ensures accuracy of forecast models • Now that we have our observations, what do we do? • There are some missing points in-between the observations • Large variations in those observations from place to place • We need to contour!
Coordinated Universal Time (or Zulu Time) • Atmospheric scientists use a coordinated universal time (UTC) • Z stands for Zulu • Examples • 0800Z • 1531Z • 2130Z • Essentially the same as Greenwich Mean Time (GMT)
Converting from UTC • Central Standard Time (CST) • November 7th 2010 - March 13th 2011 before 2 am • Central Daylight Time (CDT) • March 13th 2011 after 2 am – November 6th 2011 • How to convert to CST and CDT • CST • Subtract 600 from the time • Ex. 1700Z – 600 = 1100 (which is 11 am) • CDT • Subtract 500 from the time • Ex. 2100Z – 500 = 1700 (which is 5 pm)
Weather Maps • Importance of contoured maps • Easy diagnosing and depicting weather features and variables • Ex. Predicting atmospheric fronts, hurricanes, storms, etc. • Give easy-to-read, general information about small to large areas
Contouring • Contouring is the process of drawing isopleths • An isopleth is a line of equal value • iso – equal • pleth – value • A contour analysis involves drawing multiple isopleths • Each isopleth has a different name depending on the contour analysis
How to Contour • Interpolate between given values to correctly place an isopleth • Think about the contour as a line separating the observations with higher values on one side of the line, and lower values on the other side 5 5
How to Contour • Locate regions of high and low values first • Example • Draw the 15 °Fisotherm 15 15
How to Contour • Contour at evenly spaced increments • Example • Draw the 75 °Fand80 °Fisotherms 75 75 80 80
Circlular Isopleths • Sometimes, you will find the values are localized • In this case, you would draw a circle • Draw the 20°Fand25 °F isotherms 20 20 20 25 25
7 8 9 6 5 8 6 11 10 9 8 7 11 11 9 10 7 12 11 7 10 How to Contour • Isopleths cannot touch or cross • Isopleths cannot branch or fork NO! 10 9 10 10 9 10
How to Contour • Do not create contours where there is an absence of data
Preparing to Contour • Search for continuity (time and space) on the weather map • Eliminate what appears to be faulty or incorrect data • Ex: a 95 is found amongst 50s • Survey the map and look for: • Areas of rapid change (large gradients) • Steady areas (flat field) • Review data to determine isopleth spacing • Will you need to squeeze isopleths tightly? • Will you have room to label the isopleths?
Contouring Tips • Use a pencil • Draw smooth lines • Be neat and accurate • Label the isopleths
In-Class Examples Draw the 25°F - 50°F isotherms at 5°F intervals. 25 30 35 40 25 30 35 40 45 45 50 50
In-Class Examples Draw the isobars at 4 mb intervals, starting at 1000 mb .
Station Pressure Example • Only focus on the pressure • Convert 3 digit numbers to actual pressure • Remember, 032 => 1003.2 mb • Remove stations that do not have a pressure reading • There are two of them • Draw lines at 4 mb increments above 1000 mb • 1004 mb, 1008 mb, 1012 mb, 1016 mb, etc.