Download
1 / 43
430 likes | 453 Vues
Explore temporal and spatial variability in CO2 and H2O exchange influenced by ecosystem processes in response to climate, land-use, and disturbance. Learn about flux densities, meteorology, vegetation, and common measurements in the FLUXNET network.

E N D
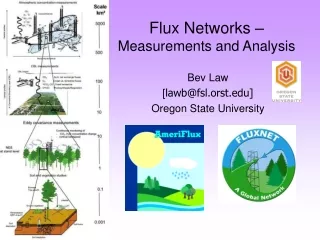
Flux Networks – Measurements and Analysis Bev Law [lawb@fsl.orst.edu] Oregon State University
Outline • Flux networks • Measurements made at flux sites • Data analysis issues • Processes influencing fluxes
AmeriFlux sites http://public.ornl.gov/ameriflux
Questions • How are temporal and spatial variability in CO2, and H2O exchange influenced by ecosystem processes in response to climate variability, land-use, management, disturbance history? • What is the relative effect of these factors? • What is the spatial and temporal variation in CO2 in continental atmospheric boundary layer, and how does this vary with topography, climate, and vegetation?
Flux densities CO2, H2O Sensible heat (H) Latent heat (lE) Momentum flux Storage flux CO2 profile Meteorology Rnet, PAR, Tair, RH, PPT Soil CO2 efflux Heat flux Tsoil soil moisture Bulk density, texture, carbon Vegetation Aboveground biomass, tree dimensions Litterfall/mass LAI Physiology (foliage respiration, A-Ci) Common Measurements
FLUXNET 2001 157 Towers
Distribution of Towers by Global Precip and Temp La Selva Site Wind River Site Alaskan Sites
Selected ancillary data in database* Vegetation type 137 Species 94 Tower height 95 Stand age 72 Annual Temp/PPT 114 sites LAI 194 at 70 sites NPP 63 at 27 sites Growing season 24 sites Soil C/N 27 sites Leaf N 8 sites *based on 172 flux tower sites, May 2002
Fluxnet Website ORNL DAAC http://www.fluxnet.org/
Flux-Model-MODIS Comparison * Fluxes:17 tower flux sites • Micrometeorology posted near real-time • Gap-filled flux estimates posted annually * Models: open to all modelers • Common site characteristics–model driver data * MODIS: 8 products for 25 sites(8-day composites) • Tsurface, Veg Index, LAI, fPAR, Photosynthesis (8-day and annual), Surface Reflectance, BRDF • Includes EOS Core Validation Sites, Flux Tower Sites, BigFoot Sites, LAINet Sites • Format is 7 km x 7 km cutouts in ISIN projection in ASCII files
Eddy covariance – Fundamental assumptions • Steady-state conditions: dc/dt=0 • Horizontal homogeneity: udc/dx=0; dFx/dx=0 • Constant flux layer, dFz/dz=0 Stephen McMillan
Where to Make Flux Measurements? • Horizontally Homogeneous + Extensive Vegetation (fetch ~100 x ht) • ‘Flat’ Terrain • Fully-developed Internal Boundary Layer (away from persistent circulations) • Above Roughness Sublayer: (~1.5x to 2x ht; 3-4 x canopy ht for widely scattered trees to avoid wake effects) Hanan: Krueger
Flux Calculation + Net loss to atmosphere - Net gain from atmosphere
Data Processing • Mean Removal • Coordinate Rotation • Density fluctuations cause nonzero mean vertical velocity - WPL term
Closed vs Open-path IRGA • Closed-path: water absorption and adsorption on tube walls can cause underestimate of water vapor flux by ~20% • Open-path: WPL term can be as large as flux in regions when sensible heat flux is large (e.g. arid). Data loss during wet periods
Corrections for Density Fluctuations • ___ • Fc = w’rc’+7.386·10-3lE + 0.0383H (mol m-2 s-1) • Webb-Pearman-Leuning equation is a function of: • latent heat flux density • sensible heat flux density • amount of scalar material in the atmosphere • air temperature
Effect of WPL term CO2 flux densities in a young pine stand. Indicates respiration (+ flux) when WPL term applied, but significant photosynthesis when only use the covariance (w’c’)
Factors Affecting Flux Covariances • Storage (Fc + Fstor) • Advection • Flux Divergence • Insufficient Turbulence • Limited Energy Balance Closure
Advection? Gradient in fluxes due to: -changes in source/sink of surface -changes in flow due to roughness or topography
Flow Distortion over Non-level Terrain? Impact of terrain on vertical velocity w is a function of wind direction as wind blows up, across or down a gentle slope.
Insufficient Turbulence?Tall Forest, Rough Terrain Friction velocity (u*; m/s) Under low wind speeds, CO2 seems to drain out of the control volume and not pass the imaginary line marking the canopy atmosphere interface
H LE Rn S G Energy Balance Rn = H + LE + G + S Rn = Rs.dn - Rs.up + Rl.dn - Rl.up(available energy)
Energy Balance Closure? Tall Forest FLUXNET: Mean imbalance ~20% - generally improved with u*
Flux components NEE = NEP = Pg + Ra + Rh = Pg + Re GEP = |NEE – Re| during daytime GEP = gross ecosystem production NEE = net ecosystem exchange CO2 Re = ecosystem respiration
Monthly GEP and lE – deciduous broadleaf forests (Law et al. AFM. In press)
Inter-annual Variation in Soil CO2 Efflux • Annual efflux • (g C m-2 y-1) • Young • 99’ 519 (68) • 00’ 427 (80) • 01’ 505 (38) • Old • 99’ 499 (32) • 00’ 597 (45) • 01’ 483 (68)
Net gain (sink) NEP (g C m-2 y-1) Net loss (source) (Thornton et al. 2001)
N Landscape Heterogeneity 500 m Footprint Wind direction Tower
(a) (c) (b) Changes in NEP with age (a) and the age structure of a hypothetical landscape (b) determine the cumulative NEP of the landscape (c) Jiquan Chen, Univ of Toledo
2000 Annual total Cumulative total Temperate deciduous forest Boreal coniferous forest 1500 Growing season 1000 Cumulative uptake of carbon dioxide (g C m-2) Dormant season 500 0 1992 1993 1994 1995 1996 1997 1998 1999 2000 Year
Spatial Coherence of Seasonal Flux Anomalies Differences between 1998 and 1997 - Similar pattern at several flux sites (WI, MA, Manitoba) The spring 98 warm period and a later cloudy period appear at all 3 sites. (K. Davis et al.) Air Temp [CO2] NEE
References • Aubinet, M. et al. 2000. Estimates of the annual net carbon and water exchange of European forests: the EUROFLUX methodology. Advances of Ecol.Res. 113-174. • Baldocchi, D.D. et al. 1988. Measuring biosphere-atmosphere exchanges of biologically related gases with micrometeorological methods. Ecology 69:1331-1340. • Kaimal, J.C., J.J. Finnigan. 1994. Atmospheric Boundary Layer Flows: Their Structure and Measurement. Oxford University Press, Oxford, UK. 289 pp. • Law, B.E.et al. 2001. Carbon storage and fluxes in ponderosa pine forests at different developmental stages. Global Change Biol. 7:755-777. • Raupach, MR, Finnigan, JJ. 1997. The influence of topography on meteorological variables and surface-atmosphere interactions. 190:182-213 • Schmid, HP, Lloyd, CR. 1999. Spatial representativeness and the location bias of flux footprints over inhomogeneous areas. Agric. For. Meteorol 93, 195-209. • Wilson, K.B., et al. 2002. Surface energy partitioning between latent and sensible heat flux at FLUXNET sites. Agric. For. Meteorol. In press.
More references (on Fluxnet & Metolius) • Bowling, D.R., N.G. McDowell, B.J. Bond, B.E. Law, J. Ehleringer. 2002. 13C content of • ecosystem respiration is linked to precipitation and vapor pressure deficit. • Oecologia 121: 113-124. • Irvine, J., Law, B.E., 2002. Seasonal soil CO2 effluxes in young and old ponderosa pine • forests. Global Change Biology. In press. • Law, B.E., E. Falge, D.D. Baldocchi, et al. 2002. Carbon dioxide and water vapor exchange • of terrestrial vegetation in response to environment. Agric. For. Meteorol. In press. • Law, B.E., F.M. Kelliher, D.D. Baldocchi, P.M. Anthoni, J. Irvine. 2001. Spatial and • temporal variation in respiration in a young ponderosa pine forest during a summer drought. • Agric. For. Meteorol. 110:27-43. • Thornton, P., B.E. Law, and D.S. Ellsworth, H. Gholz, A. Goldstein, D. Hollinger, K.T. • Paw U. Modeling the effects of disturbance history and climate on carbon and water budgets • in evergreen needleleaf forests. Agric. For. Meteorol. In press.
Acknowledgements • Dennis Baldocchi • Dick Olson • DOE, NASA


![Background [1] Sources of Precipitation Information](https://cdn3.slideserve.com/5700776/slide1-dt.jpg)