Chandra
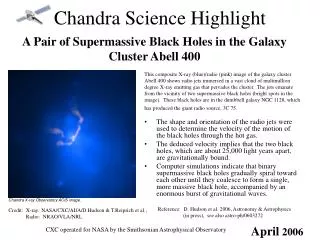
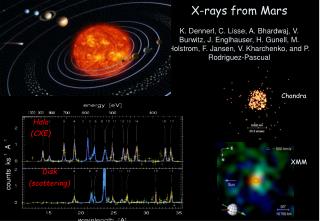
X-rays from Mars K. Dennerl, C. Lisse, A. Bhardwaj, V. Burwitz, J. Englhauser, H. Gunell, M. Holstrom, F. Jansen, V. Kharchenko, and P. Rodriguez-Pascual. Chandra. Halo (CXE). XMM. Disk (scattering).

Chandra
E N D
Presentation Transcript
X-rays from MarsK. Dennerl, C. Lisse, A. Bhardwaj, V. Burwitz, J. Englhauser, H. Gunell, M. Holstrom, F. Jansen, V. Kharchenko, and P. Rodriguez-Pascual Chandra Halo (CXE) XMM Disk (scattering)
There Are Many Sources of X-rays in the Solar System (Planets, Moons, Io Flux Torus, Comets, Sun); But the 0.3-1.5 keV Emission Mechanisms Are Still Uncertain. Scattering Charge Exchange Mars Venus Auroral Saturn Jupiter Comets Excellent new review of the current understanding of s.s. xrays : Bhardwaj et al., PSS 55, 1135 (2007)
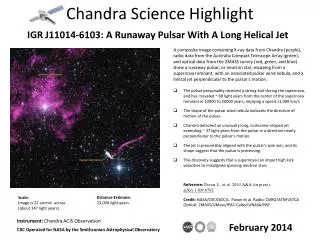
January 2001: first X-ray image of Venus (Chandra ACIS-I) First X-ray observation of Venus during solar maximum: Scattering of solar X-rays detected, but no conclusive evidence of charge exchange. => To understand the charge exchange component, the solar wind flux and charge state will have to be very well known. The first two-spacecraft measure of the solar wind at another planet, by MESSENGER and Venus Express during the V2 flyby, will provide this data. Solar X-rays Venus ACIS-I Dennerl et al. 2002, A&A386, 319
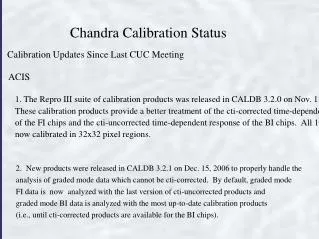
Planning the Mars observation 2001 July 4
Simulated X-ray images of Mars due to fluorescent scattering of solar X-rays N-Kα Lx~ 0.1 MW O-Kα Lx~ 1.7 MW C-Kα Lx~ 2.9 MW
Spatial distribution of X-ray photons around Mars Chandra observation
Spectral distribution of X-ray photons around Mars background Chandra observation
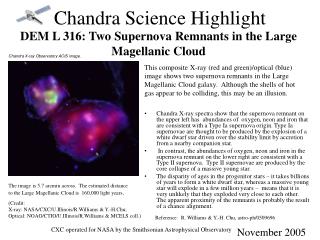
0° 30° 60° 90° X-ray imaging of the solar wind – Mars interaction 18.2° Trajectories for O6+ ions around Mars Parallel projection of X-ray emission on 4 July 2001 Parallel projections of X-ray emission at solar minimum Gunell et al. 2004, Geophysical Research Letters 31 Holmström, Barabash, Kallio, Geophysical Research Letters 28, 1287-1290, 2001
Spatial distribution of X-ray photons around Mars Charge exchange simulation Gunell et al. 2004, Geoph. Res. Letters 31 Chandra observation
Mars observed with XMM-Newton 2003 Nov 20, 00:08 – Nov 21, 04:57 UTC XMM-Newton
Mars observed with XMM-Newton 2003 Nov 20, 00:08 – Nov 21, 04:57 UTC
XMM-Newton observation of Mars EPIC pn sky coordinates X-ray image exposure map
XMM-Newton images of Mars pixel size: 1“ pixel size: 5“
O7+ N6+ O6+ C4+ Ne7+ ? C5+ CO2 High resolution X-ray spectroscopy of Mars with RGS “disk” + 10“ - 10“ dispersion direction N2 G(O+6) = (f+i)/r = 0.8 +/- 0.6, i=0 Lx = 3.4 +/- 0.4 MW
O7+ N6+ O6+ C4+ Ne7+ ? C5+ CO2 High resolution X-ray spectroscopy of Mars with RGS + 50“ “halo” + 15“ - 15“ - 50“ G(O+6) = (f+i)/r = 5 - 6, i =0 Lx = 12.8 +/- 1.4 MW O+8/ O+7 = 0.34 +/- 0.10
O7+ N6+ O6+ C4+ Ne7+ ? C5+ CO2 halo disk High resolution X-ray spectroscopy of Mars with RGS
X-ray line emission from Mars Mars atmosphere fluorescence 3.4 ± 0.4 MW solar wind ions charge exchange 12.8 ± 1.4 MW
X-ray images of Mars in individual emission lines (!) O7+: 2p → 1s O6+: 2 3S1→ 1 1S0
X-ray images of Mars in individual emission lines (!) C5+: 3p → 1s C5+: 2p → 1s
X-ray images of Mars in individual emission lines (!) CO2: 1πg→ 1s N2: 2p → 1s CO2: 4σg→ 1s, 3σu→ 1s, 1πu → 1s
X-ray images of Mars in individual emission lines (!) Emission centered on disk. Emission in crescent offset towards the Sun. Emission above and below Poles (!?) or in limb-effect crescent.
Questions : Is Ne72 line really Ne82 line? Ne+7 is lithium like, should have a low energy transition, not one at 800 - 900 eV. The Ne+8 lines are at 905, 916, and 922 eV. (Ali) How is RGS data binned? Non-linear, so is 872 eV really 872, or maybe 905 - 920 eV or 830? (Wargelin) What is the composition of the Martian exosphere in the Holstrom et al. model? All H? No C, O, CO2? Viking may be the only s/c to measure exosphere composition. Was Mars in Northern summer in 2003, explaing brighter emission of O on the North? (Cravens, Kharchenko) What does the spatial extent of the CO2 tell you? Is the apparent CO2 in the halo due to the coarse XMM imaging (PSF wings), or due to CO2 in the exosphere? Is the halo emission overlapped by emission from the extended Martian disk? (Kharchenko) How good are the SNR of the different lines in the disk and halo fits? 2 pts not fit at 385 eV seem as significant as fit lines at other wavelengths (Beiersdorfer) What is the spectral profile of the O+6 f,I,r lines? (Kharchenko) O+8/O+7 ratios varies a LOT in the SW. SW O+8/O+7 ratio varies by up to 2 orders of magnitude. We have to be careful when comparing to an “average”. Also, how can the O+7/O+6 ratio be 0.34, yet the solar wind flux and activity be 10x higher than during the CXO observations in 2001? I.e., cold stable wind ratios with very high density? (Edgar)