Download
1 / 12
140 likes | 355 Vues
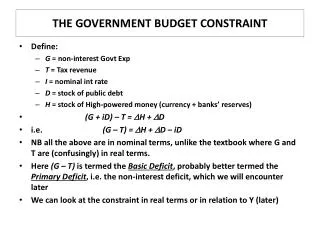
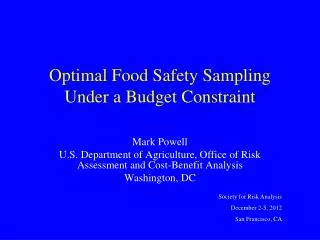
Optimal Food Safety Sampling Under a Budget Constraint. Mark Powell U.S. Department of Agriculture, Office of Risk Assessment and Cost-Benefit Analysis Washington, DC. Society for Risk Analysis December 2-5, 2012 San Francisco, CA. Conventional Food Safety Sampling Plan Design.

E N D
Optimal Food Safety Sampling Under a Budget Constraint Mark Powell U.S. Department of Agriculture, Office of Risk Assessment and Cost-Benefit Analysis Washington, DC Society for Risk Analysis December 2-5, 2012 San Francisco, CA
Simple Optimization Model • = contaminated lots rejected • m = lots • n= samples per lot • p = sample unit prevalence • 1-qn = p(reject lot) • S.t.: Budget constraint (CT)
Simple Optimization Model • (budget constraint) • CT= budgeted total sampling cost ($) • = cost per lot ($) • = cost per sample ($) = 0
Simple Optimization Model • ObjFxn: • Constraint:
Simple Optimization Model 1) 2) 3) 4) 5) 6) Note:
Results • If budget constraint does not permit testing 100% of lots, noptfor a given sample unit prevalence (p) depends only on the cost ratio (Cl/Cn). • The budget constraint (CT ) determines absolute number of lots tested in a budget period (m) or the frequency of lot inspection (1/m)
Conclusion • National Research Council (1985): Food safety sampling plans based on “sound statistical concepts” need to “achieve a high degree of confidence in the acceptability of a lot.” • Economic design of measures is not new. • Scarce resources should force us to consider the tradeoff between depth (n) and coverage (m). • Multiple, competing objectives for sampling.
Disclaimers The opinions expressed herein are the views of the author and do not necessarily reflect the official policy or position of the United States Department of Agriculture. Reference herein to any specific commercial products, process, or service by trade name, trademark, manufacturer, or otherwise, does not necessarily constitute or imply its endorsement, recommendation, or favoring by the United States Government.