Survival distribution function
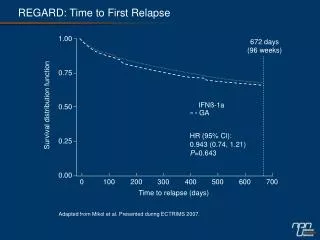
REGARD: Time to First Relapse. 1.00. 672 days (96 weeks). 0.75. IFNß-1a. Survival distribution function. 0.50. GA. HR (95% Cl): 0.943 (0.74, 1.21) P =0.643. 0.25. 0.00. 0. 100. 200. 300. 400. 500. 600. 700. Time to relapse (days).

Survival distribution function
E N D
Presentation Transcript
REGARD: Time to First Relapse 1.00 672 days (96 weeks) 0.75 IFNß-1a Survival distribution function 0.50 GA HR (95% Cl): 0.943 (0.74, 1.21) P=0.643 0.25 0.00 0 100 200 300 400 500 600 700 Time to relapse (days) Adapted from Mikol et al. Presented during ECTRIMS 2007.
Effect of Therapies on the Rate of Brain Atrophy Over Five Years 0 -0.5 -1 -1.5 -2.27 -2 P<0.0001 -2.62 PBVC over five years (%) P=0.0336 -2.5 -3.21 P<0.0001 -3 -3.5 Any treatment vs. control P<0.0001* -4 -4.75 -4.5 P<0.0001 -5 *Control IFNß s.c. IFNß i.m. GA For all treatment groups, the rate of brain atrophy was based on actual five years of continuous therapy. *Control group patients were on no treatment for a period ranging from 8 to 24 months, and the rate of brain atrophy was annualized for the control group. (Mann-Whitney) Adapted from Khan et al. Mult Scler 13(Supp 2):S181. Presented during ECTRIMS 2007.