Download
1 / 1
10 likes | 145 Vues
TRANSMISSION EFFICIENCY MEASUREMENT AT THE FNAL 4-ROD RFQ. MOPP050. J.-P. Carneiro (FNAL ) , F.G. Garcia (FNAL) J.-F. Ostiguy (FNAL), A . Saini (FNAL), R. Zwaska (FNAL) B. Mustapha (ANL), P.N. Ostroumov (ANL).

E N D
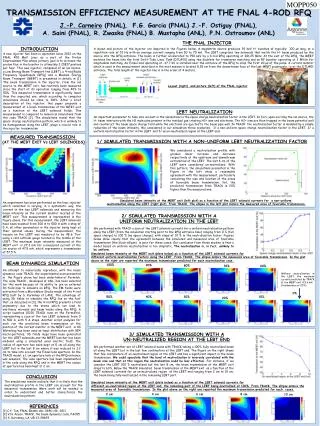
TRANSMISSION EFFICIENCY MEASUREMENT AT THE FNAL 4-ROD RFQ MOPP050 J.-P. Carneiro (FNAL), F.G. Garcia (FNAL) J.-F. Ostiguy (FNAL), A. Saini (FNAL), R. Zwaska (FNAL)B. Mustapha (ANL), P.N. Ostroumov (ANL) A layout and picture of the injector are depicted in the Figures below. A magnetron source produces 35 keV H- bunches of typically 100 µs long, at a repetition rate of 15 Hz with an average current ranging from 50 to 70 mA. The LEBT comprises two solenoids that match the H- beam produced by the source into the RFQ entrance. The beam is further accelerated to 750 keVby a 4-rod RFQ operating at 201.25 MHz. At the exit of the RFQ, the MEBT matches the beam into the first Drift-Tube Linac Tank (DTL#01) using two doublets for transverse matching and an RF buncher operating at 3 MV/m for longitudinal matching. An Einzel lens operating at -37.7 kV is installed near the entrance of the RFQ to chop the first 20 µs of the pulse. A current monitor which is used in the measurement described in the next session is located 8.25 cm from the downstream face of the last MEBT quadrupole, i.e at the DTL#01 entrance. The total length of the injector line is in the order of 4 meters. THE FNAL INJECTOR INTRODUCTION A new injector has been in operation since 2012 on the FNAL 400 MeV Linac as a part of the Proton Improvement Plan whose primary goal is to increase the proton flux in the booster to ultimately 2.25E17 protons per hour. This new injector, composed of an ion source, a Low Energy Beam Transport line (LEBT), a 4-rod Radio Frequency Quadrupole (RFQ) and a Medium Energy Beam Transport (MEBT) is presented in details in [1]. The beam transmission in the injector, from the ion source to the MEBT exit, has routinely been measured since the start of its operation ranging from 40% to 50%. This measured transmission is significantly lower than the expected one, which according to computer simulations should be close to 100%. After a brief description of the injector, this paper presents a measurement of a beam transmission at the MEBT exit as a function of the LEBT solenoid fields. This measurement is compared to numerical simulations from the code TRACK [2]. The simulations reveal that the space charge neutralization pattern, which is unlikely to be homogeneous along the LEBT, plays a crucial role in the injector transmission. Layout (right) and picture (left) of the FNAL injector LEBT NEUTRALIZATION An important parameter to take into account in the simulations is the space charge neutralization factor in the LEBT. In fact, upon exciting the ion source, the H- beam interacts with the H2 molecules present in the residual gas creating H2+ ions and electrons. The H2+ ions are then trapped in the beam potential well and counteract the beam space charge field while the electrons are ejected to the beam pipe wall. In TRACK the neutralization factor is modeled by a simple reduction of the beam intensity. We considered in our simulation three scenarios: 1/ a non-uniform space charge neutralization factor in the LEBT, 2/ a uniform neutralization factor in the LEBT and 3/ an un-neutralized region at the LEBT end. MEASURED TRANSMISSION (AT THE MEBT EXIT Vs LEBT SOLENOIDS) 1/ SIMULATED TRANSMISSION WITH A NON-UNIFORM LEBT NEUTRALIZATION FACTOR We considered a neutralization profile with gradual linear increase and decrease respectively at the upstream and downstream extremities of the LEBT. The last 6 cm of the LEBT were considered un-neutralized. With this pattern, the simulations presented in the Figure in the left show a reasonable agreement with the measurement, particularly concerning the size and location of the areas of favorable beam transmission. Yet, the predicted transmission from TRACK is 20% higher than the measured one. Simulated beam intensity at the MEBT exit (left plot) as a function of the LEBT solenoid currents for a non-uniform neutralization along the LEBT (right plot). From TRACK. The ellipse in the left plot mimics the measured area of favorable transmission. An experiment has been performed on the linac injector which consisted in varying, in a systematic way, the current in the two LEBT solenoids and measuring the beam intensity on the current monitor located at the MEBT exit. This measurement is represented in the Figure above. For this measurement, the LEBT solenoids have been scanned from 300 A to 500 A with a step of 5 A, all other parameters in the injector being kept at their optimal values. During the measurement, the vacuum on the LEBT was measured to be 4E-6 Torrusing a cold cathode gauge located in the middle of the LEBT. The maximum beam intensity measured at the MEBT exit is 27.3 mA for a measured current at the ion source of 47.5 mA, which represents a transmission of 57.5 %. 2/ SIMULATED TRANSMISSION WITH A UNIFORM NEUTRALIZATION IN THE LEBT We performed with TRACK a scan of the LEBT solenoid currents for a uniform neutralization pattern along the LEBT (from the simulation starting point to the RFQ entrance hole) ranging from 0 % (full space charge) to 100 % (no space charge), with steps of 10 % in the neutralization factor. Figures below show clearly that the agreement between the simulated and measured area of favorable transmission (the black ellipse) is poor for these cases. Our conclusion from these studies is that a model based on uniform neutralization is too simplistic. The neutralization is, in fact, unlikely to be uniform. Simulated beam intensity at the MEBT exit (plots below) as a function of the LEBT solenoid currents for different uniform neutralization factors along the LEBT. From TRACK. The ellipse mimics the measured area of favorable transmission. In the plot above on the right are reported the maximum transmission predicted for each neutralization case. BEAM DYNAMICS SIMULATION 100% 90% 80% 60% 70% An attempt to numerically reproduce, with the beam dynamics code TRACK, the experimental scan presented in the Figure above has been undertaken at Fermilab. The code TRACK , developed at ANL, has been selected for this work because of its ability to use an external 3D field map to simulate an RFQ. The EM fields were extracted from a MicroWave Studio model of the 4-rod RFQ built by S. Kurennoy at LANL. The advantage of using 3D fields to simulate the RFQ lies on the fact that, as discussed in [3], the 4-rod RFQ presents a field asymmetry due to the stems which can lead to emittance increase and beam losses along the RFQ. A script launches 10201 TRACK runs on the FermiGrid, representing a scan of the two LEBT solenoids from 0 to 500 A, with 5 A steps. Another script analyses for each run the predicted beam transmission at the position of the current monitor in the MEBT exit. A 4D Waterbag has been used as input distribution with 5E4 macro-particles, 3D fields maps have been generated for the LEBT solenoids and the MEBT buncher has been modeled using a simulated axial electric field. The radius of aperture has been kept at 5 cm all along the LEBT but in the last 8 cm where it was reduced to 2.2 cm to take into account the Einzel lens aperture. In the TRACK model, a 1 cm aperture hole at the RFQ entrance was assumed. The vane aperture has been implemented in the code along the RFQ and in the MEBT the radius of aperture has been kept at 2 cm. Without neutralization in the LEBT, the maximum current predicted by TRACK at the MEBT exit if 9.6 mA (transmission of 20%) 0% 50% 40% 30% 10% 20% 3/ SIMULATED TRANSMISSION WITH A UN-NEUTRALIZED REGION AT THE LEBT END We performed another set of LEBT solenoid scans with TRACK taking a 100% fully neutralized beam all along the LEBT but in the last few centimeters at the LEBT end. The Figure on the right shows that few centimeters of un-neutralized region at the LEBT end has a significant impact in the beam transmission. We could speculate that the level of neutralization is inversely correlated with the beam size and that at this region the neutralization could be less effective. For instance, if we consider the LEBT 100 % neutralized but the last 8 cm, the beam transmission at the MEBT exit drops to 63%. Below the TRACK simulated beam transmission at the MEBT exit as a function of the LEBT solenoid currents for an un-neutralized region at the LEBT end ranging from 2 cm to 10 cm, the beam being fully neutralized in the remaining LEBT part. CONCLUSION The simulations results indicate that it is likely that the neutralization profile in the LEBT can account for the measured transmission. More work will be needed in order to understand and better characterize the neutralization pattern. Simulated beam intensity at the MEBT exit (plots below) as a function of the LEBT solenoid currents for different un-neutralized region at the LEBT end, the remaining part of the LEBT being neutralized at 100%. From TRACK. The ellipse mimics the measured area of favorable transmission. In the plot above on the right are reported the maximum transmission predicted for each cases. 2 cm 4 cm 6 cm 8 cm 10 cm REFERENCES [1] C.Y. Tan, FNAL Beams-doc-3646-v16, 2011 [2] V.N. Aseev, TRACK, the beam dynamics code, PAC05 [3] S. Kurennoy, LA-UR-13-28693