Theorising Learning from Incidents: A Human-Machine Systems Perspective
220 likes | 379 Vues
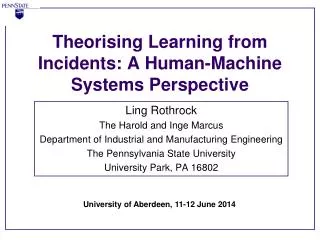
Theorising Learning from Incidents: A Human-Machine Systems Perspective. Ling Rothrock The Harold and Inge Marcus Department of Industrial and Manufacturing Engineering The Pennsylvania State University University Park, PA 16802. University of Aberdeen, 11-12 June 2014. Ling Rothrock.

Theorising Learning from Incidents: A Human-Machine Systems Perspective
E N D
Presentation Transcript
Theorising Learning from Incidents: A Human-Machine Systems Perspective Ling Rothrock The Harold and Inge Marcus Department of Industrial and Manufacturing Engineering The Pennsylvania State University University Park, PA 16802 University of Aberdeen, 11-12 June 2014
Ling Rothrock • EMPLOYMENT HISTORY: • Associate Professor, The Pennsylvania State University, 2008-present • Assistant Professor, The Harold & Inge Marcus Department of Industrial & Manufacturing Engineering, The Pennsylvania State University, 2002-2008 • Assistant Professor, Department of Biomedical, Industrial, and Human Factors Engineering, Wright State University, Dayton, OH, 2000-2002 • Research Scientist, Army Research Laboratory, Human Research and Engineering Directorate, FT Huachuca Field Office, AZ, 1998-2000. • Officer, United States Army, FT Bliss, TX, 1996-1998. • PhDs • Jung Hyup Kim, 2013, Assistant Professor, University of Missouri. • Namhun Kim, 2010, Assistant Professor, Ulsan National University of Science and Technology • Jing Yin, 2009, Consultant, The Ironside Group, Inc. • Damodar Bhandarkar, 2008, Senior HF Engineer, Pritney Bowes • Hari Thiruvengada, 2007, UX Design Manager, Honeywell, Inc. • Sungsoon Park, 2007, Principal Consultant, Samsung SDS • Dongmin Shin, 2005, Associate Professor, Hanyang University
The objectives of my sabbatical leave are to improve my professional skills through working with notable researchers in my field; applying my skills toward challenging human-machine problems in refinery process control; and create case studies to give undergraduate and graduate students an appreciation for current problems in process control. Purpose of Visit
Department of Industrial and Manufacturing Engineering at Penn State University • World’s first industrial engineering • department founded in 1909 • Students: ~450 undergraduates; • ~70 MS; ~70 PhD • 32 faculty members • Research Areas • Human Factors – ergonomics, human centered design, human-computer interaction • Manufacturing – distributed systems and control, design • Operations Research – applied probability and stochastic systems, optimization, game theory, statistics and quality, simulation • Production, supply chain, health systems engineering, service engineering
Consider Advanced Process Control ASM Examples drawn from the Abnormal Situation Management (ASM) Consortium
Sources of Plant Disturbances Categories Source: ASM Consortium Defective Installation Failure to Follow Procedure/Instruction Failure to Recognise Problem Inadequate/Incorrect action Inadequate Work Practices Inadequate or No Procedure PeopleandWorkContextFactors Defective Equipment Equipment Design Flaw Equipment/Mechanical Failure EquipmentFactors Operation Beyond Original Design Limits Process Design Flaw ProcessFactors 0 3 6 9 12 15 18 21 24 Frequency
Causes of Plant Disturbances Causes of Process Upsets 40% 40% Source: ASM Consortium 20% Human Error Equipment Failure Other Causes of Equipment Failure Presented by N Kosaric at 2005 Defect Elimination Conference RISK OF HUMAN ERROR
Source: ASM Consortium The Fundamental Problem • DESIGN • All Apply to Psychology Anthropology LIMITATIONS SOURCES OF ERROR ABILITIES Computer Science TOOLS TASKS Engineering “Failure to Adequately Inform and Engage the Human-in-the-Loop in Automated Processes.” HUMAN FACTORS MACHINES JOBS SYSTEMS WORK ENVIRONMENT
Typical analyses that focus on just root causes are insufficient for identifying systemic improvement opportunities: Root causes explain ‘why’ something occurred, not ‘what’ occurred in terms of failures Root causes are general and not specific enough to drive continuous improvement – details are buried in incident report No effective methods for aggregating root cause details across incidents for systemic analysis of problems and improvements Key Learning from ASM Projects Incident Event 1 Event 2 Event N Event N+1 ‘Why’ event occurred Root Cause Root Cause How aggregate details within and across incidents? Missing ‘What’ went wrong
Models Research Process to Improve Learning from Incidents Formulate hypothesis based on incidents and causal factors Implement dynamic events to test hypotheses Construct platform to simulation domain Human-in-the-loop (HITL) Simulation Platform Hypothesis and Experimental Design Scenario Subject-Matter Experts Data logging includes operator interaction, system states, and required activities Validate findings in context Extend findings to industry Call Centers Database Construct computational models of human performance and judgment Enable data access to measure performance and inform model building Process Control Command and Control
Human-in-the-loop (HITL) Simulation Platform HITL Performance Measurement: Windows of Opportunity Environment Situation No Situation Required Required Response False Alarm G Early On-time Late B Correct A C Action No Action D E F Incorrect Miss Correct Rejection I H A construct that specifies a functional relationship between a required situation and a time interval that specifies availability for action.
Windows using Temporal Logic • Given an action , b, and a time window, w, • we define 6 predicates, M, such that, A B C D E F G H Rothrock, L., & Narayanan, S. (Eds.). (2011). Human-in-the-loop Simulations: Methods and Practice. London: Springer-Verlag.
Experimentation Strategy Script Maker Scenario Phase 1: Scenario Generation Phase 2: Run Simulation Each member communicates with the other using speech and internal messaging system Team Role A Team Role B Team Role C Output files C Output files A Output files B Phase 3: Analyze Team/Individual Performance Team/ Individual member performance Integrated Output files Performance Analyzer Tool Human-in-the-loop (HITL) Simulation Platform Extension to Team Research
Database Research Question: Is one form of training superior? Rothrock, L., Cohen, A., Yin, J., Thiruvengada, H., & Nahum-Shani, I. (2009). Analyses of Team Performance in a Dynamic Task Environment. Applied Ergonomics, 40(4), 699-706.
78 participants from a major university (in 39 teams) randomly received one of three training conditions (between-subjects design) Each participant trained on 6 10-min scenarios and then tested on 2 10-min scenarios (high and low workload) Three training conditions (no training, team coordination training, task delegation training) used varying in type of presentation (nothing, reading material, or video) Experimental Design
Teamwork dimensions Information Exchange Relative Accuracy Index (RAI) Environment Team HITL Simulation Communication Supporting Behaviour Operator Response Truth Maintenance System Latency Index (LI) Team Initiative/ Leadership Team Performance Assessment
consider logistic regression as the model for analyzing data in which the dependent variable is a proportion: that can also be expressed as: Which is a particular case of the Generalized Linear model, in which linear regression models are extended to the exponential family of distributions that includes both the normal and the binomial distributions. The Statistical Model
Experiment designed to evaluate the effect of a certain type of training on RAI Since the dependent variable (RAI) is a proportion, the suitable distribution for modeling it, is the binomial distribution RAI was measured for each one of the two team members, at two stress levels (Low/High), where each team belonged to one of three training groups (NT, TCT, TDT). For each of the 39 teams, divided randomly among the three types of training, there are fourdependent measures of RAI since each team member (SO and AIC) has two outcome measures, corresponding to high and low levels of stress. The Statistical Model (cont.)
In IE condition TCT training significantly improved performance Negative correlation between AIC and SO under stress In SB condition Effects of stress more pronounced Activities involved require longer key sequences and, under stress, fewer identifications were made Findings
In TI/L condition Absence of DCA activities suggesting limited cognitive resources Participants in TCT condition outperformed those in NT or TDT conditions Findings(cont.)
Quantitative assessment of teamwork through combination of teamwork and task dimensions with time windows Provides insight into the impact training methods on performance Transition to opportunities in process control systems Implications of Work