MTSS Essential Component: Progress Monitoring
MTSS Essential Component: Progress Monitoring. Module 5. Welcome!. Introductions Materials Parking lot. Introductory MTSS Module Series Overview. Session Outcomes . By the end of this session, participants will be able to:

MTSS Essential Component: Progress Monitoring
E N D
Presentation Transcript
Welcome! • Introductions • Materials • Parking lot
Session Outcomes • By the end of this session, participants will be able to: • Define progress monitoring and its purposes within an MTSS framework. • Explain how districts and schools can use the NCII tools chart to select and evaluate progress monitoring tools. • Describe the components of the progress monitoring process.
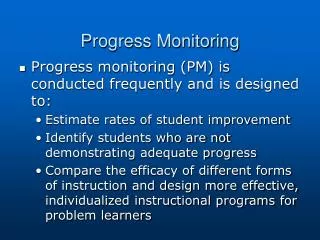
Why Progress Monitoring? • When teachers use systematic progress monitoring to track their students' progress in reading, mathematics, or spelling, they are better able to identify students in need of additional or different forms of instruction, they design stronger instructional programs, and their students achieve better. • (Fuchs & Fuchs, 2002, p. 1)
Why is Progress Monitoring Important? To ensure that underachievement in a child suspected of having a specific learning disability is not due to lack of appropriate instruction in reading or math…must consider…. • Data-based documentation of repeated assessments of achievement at reasonable intervals, reflecting formal assessment of student progress during instruction, which was provided to the child’s parents. 34 C.F.R. § 300.309(a-b) 34 C.F.R. § 300.309(a-b)
Think-Pair-Share • Think of a time when you provided extra support or intervention to a student who was struggling. How did you know he or she was benefiting? What data did you use? • Pair with your partner. • Share your experiences. Discuss how they are similar and different.
Critical Features of Progress Monitoring • Progress Monitoring Tools • Progress Monitoring Process Progress monitoring is repeated measurement of student performance over the course of intervention to index/quantify responsiveness to intervention and to thus determine, on an ongoing basis, when adjustments to the program are needed to improve responsiveness. (National Center on Intervention Interventions, 2017)
Short Vowel I Short Vowel A 10 8 6 Number of Words Read Correctly 4 2 0 2 4 6 8 10 12 14 WEEKS Mastery Measure:Focus on Specific Subskill
Short Vowel I Short Vowel A 10 8 6 Number of Words Read Correctly 4 2 0 2 4 6 8 10 12 14 WEEKS Mastery Measure:Focus on Specific Subskill
Mastery Measure: Focus on Series of Short-term Instructional Objectives • Short Vowel A • Short Vowel I • Short Vowel O • Short Vowel U • Short Vowel E • Vowel Patterns A • Vowel Patterns I • Vowel Patterns O • Vowel Patterns U • Vowel Patterns E
Mastery Measure: Monitor Progress of Each Objective Short Vowel I Short Vowel O Short Vowel A 10 8 6 Number of problems correct in 5 minutes 4 2 0 2 4 6 8 10 12 14 WEEKS
THINK-PAIR-SHAREAdvantages of Mastery Measures • What do you see as advantages of data from mastery measures? • Reported Advantages • Skill and program specific • Data can assist in making changes to target skill instruction • Provide data about IF a child can learn a skill
THINK-PAIR-SHARELimitations of Mastery Measures • What do you see as potential limitations of data from mastery measures? • Reported Limitations • Data do not reflect skill maintenance or generalization. • Number of objectives mastered does not relate well to performance on criterion measures. • Measurement methods are often designed by teachers, with unknown reliability and validity. • Scores cannot be compared longitudinally.
General Outcome Measure (GOM) • Reflects overall competence in the yearlong curriculum • Describes individual children’s growth and development over time (both “current status” and “rate of development”) • Provides a decision making model for designing and evaluating interventions • Is used for individual children and for groups of children
Interpreting Data from GOMs Student Data Goal Line Trend Line
Advantages of GOMs • Focus is on repeated measures of performance • Makes no assumptions about instructional hierarchy for determining measurement • Curriculum independent • Incorporates automatic tests of retention and generalization • Often aligns with screener tool
Critical Feature 1: Progress Monitoring Tools CRITERIA 1. have sufficient number of alternate forms of equal and controlled difficulty to allow for progress monitoring at recommended intervals based on intervention level; • Tier II: At least 9 alternate forms • Tier III: At least 20 alternate forms Criteria 1. Sufficient number of alternate forms Handouts 5.1 & 5.2
Critical Feature 1: Progress Monitoring Tools CRITERIA 2. specify minimum acceptable growth; CRITERIA 3. provide benchmarks for minimum acceptable end-of-year performance; and Criteria 2. Specify minimum acceptable growth Criteria 3. Benchmarks for minimum acceptable end-of-year performance Handouts 5.1 & 5.2
Critical Feature 1: Progress Monitoring Tools CRITERIA 4. have available reliability and validity information for the performance-level score and staff is able to articulate the supporting evidence. Criteria 4. Reliability and validity information for the performance-level score Handouts 5.1 & 5.2
Critical Feature 2: Progress Monitoring Process • CRITERIA 1. progress monitoring occurs at least monthly for students receiving Tier II and at least weekly for students receiving Tier III. • What does the research say? • As the number of data points increases, the effects of measurement error on the trend line decreases. • Christ & Silberglitt (2007) recommended six to nine data points. Handout 5.1
Critical Feature 2: Progress Monitoring Process • CRITERIA 2: procedures are in place to ensure implementation accuracy. Goal Setting Identifying Appropriate Students Data Decision Making Data Collection and Entry
Handout 5.1: Self-Evaluation of Progress Monitoring System Handouts 5.1 & 5.2
Scenario 1: Importance of Using Validated Goal Setting Procedures GOAL: 40 WRC Student Data Goal Line Trend Line
Scenario 2: Importance of Using Validated Goal Setting Procedures GOAL: 60 WRC Student Data Goal Line Trend Line
Setting Goals Based on Logical Practices Team members must know… • How the goal was set • Why the goal was set that way • The intensity of the intervention provided to meet the goal Knowing the goal helps educators chose an intervention that will help them reach the goal.
Step 1: Establish Baseline Score • Set using same tool that will be used for progress monitoring • Approaches: • Use benchmark score (preferred) • Use the median scores of three probes or three consecutive probes if between benchmarks
Example: Establish Baseline Score Jane’s Fall Benchmark Score = 23 WRC Handout 5.3
Step 2: Set Goal - Tier II • Two options for Tier II goal setting: • End or middle-of-year benchmarks • National norms for weekly rate of improvement (ROI)
Option 1: Using Benchmarks • End or middle-of-year benchmarking • Identify appropriate grade-level benchmark • Mark benchmark on student graph with an X • Draw goal line from baseline score to X • Note: Electronic data systems will draw the goal line once the goal is selected
Option 1: Setting Goals With End-of-Year Benchmark Spring Benchmark: 60 WRC
Option 1: Setting Goals With Winter Benchmark Winter Benchmark: 42 WRC
Where do you find benchmarks? • Most published data systems provide the benchmarks within the system. • Benchmarks can also be found in the tool’s review in NCII tools chart. Criteria 3. Benchmarks for minimum acceptable end-of-year performance
Option 2: Using Weekly Rates of Improvement (ROI) • Standard Formula for Calculating Goal Using Rate of Improvement (ROI): • ROI x # Weeks + Baseline Score = GOAL ROI = 2 Digits/ Week 10 Weeks Baseline = 30 Digits GOAL = 50 Digits + = X
Where do you find ROI? • Most published data systems provide the ROI within the system. • ROI by grade can also be found in the tool’s review in NCII tools chart Criteria 2. Specify minimum acceptable growth
Handout 5.4: Progress Monitoring Goal Setting -- Jane Handout 5.4
Handout 5.4: Answers Think-Pair-Share: Which goal would you choose for this student? What is your rationale? Chart: Use Handout 5.3 to chart your goal and goal line.
Tier III Goal Setting – Using Intra-Individual Framework • Often used for students performing far below grade level or with very low skills, where typical growth rates are not appropriate. • Use three most recent data points to calculate baseline score. • Calculate student’s ROI (SROI) based on at least eight data points.
Tier III Goal Setting – Using Intra-Individual Framework GOAL = 34 WRC SROI = 1.0 WRC Baseline = 19 WRC
Tier III Goal Setting – Using Intra-Individual Framework • Why 1.5? • We know the current SROI is not sufficient to close the achievement gap; we want to increase growth at least by half (x 1.5). • A more ambitious goal may be set if appropriate (e.g., if after several weeks of progress monitoring, the current SROI exceeds the goal SROI). • Never lower the goal! Change the intervention!
Handout 5.5: Tier III Goal Setting Handout 5.5
Handout 5.5: Answers Handout 5.5
Is it Working? Interpreting Progress Monitoring • Decision rules for PM graphs Three – Four Point Rule Trendline Analysis