Download
1 / 38
380 likes | 639 Vues
Population Dynamics and Growth. Exponential Growth. ideal habitat -maximum reproduction -unlimited resources. Population size ( N ). Increase often followed by crash. Time ( t ). Reindeer on an Alaskan island. 2,000. 1,500. Number of reindeer. 1,000. 500. 1910. 1920. 1930. 1940.

E N D
Exponential Growth • ideal habitat • -maximum reproduction • -unlimited resources Population size (N) Increase often followed by crash Time (t)
Reindeer on an Alaskan island 2,000 1,500 Number of reindeer 1,000 500 1910 1920 1930 1940 1950 Year
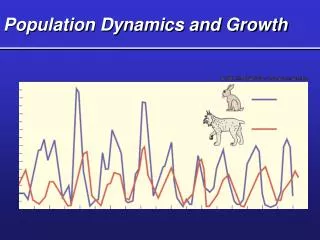
Moose and wolves on Isle Royale 5,000 Moose population Wolf population 4,000 3,000 Number of moose 100 90 80 2,000 70 60 Number of wolves 50 40 1,000 30 20 500 10 0 1900 1910 1930 1950 1970 1990 2000 Year 1999
Logistic Growth Carrying capacity -accelerating, decelerating K -growth slows as population size approaches carrying capacity Population size (N) -number that environment can support indefinitely Time (t) Carrying capacity set by limiting factor
Sheep in Tasmania 2.0 1.5 Number of sheep (millions) 1.0 .5 1800 1825 1850 1875 1900 1925 Year
Human population growth-exponential or logistic? -appears exponential -history may suggest logistic -periods of rapid growth followed by stability
Human population growth-exponential or logistic? Cultural evolution -tool-making revolution -agricultural revolution -industrial (technological) revolution
Carrying capacity for humans Set by: -famine -disease -warfare Will these become more common as population approaches carrying capacity?
Population Demographics • What affects human population size and growth rate? Birth rate and death rate Migration rate Fertility rate Age structure Average marriage age
Factors Affecting Human Population Size Population Change = (Births + Immigration) – (Deaths + Emigration) • Population change equation • Zero population growth (ZPG) • Birth rate (number/1000 people/year) • Death rate (number/1000 people/year)
Birth and death rates • U.S. - 16 and 9 (7 or 0.7%) • Rwanda - 52 and 18 (34 or 3.4%) • World - 26 and 9 (17 or 1.7%) 32 30 28 26 24 Births per thousand population 22 20 18 End of World War II 16 Demographic transition Depression Baby boom Baby bust Echo baby boom 14 0 1910 1920 1930 1940 1950 1960 1970 1980 1990 2000 2010 Year
Factors Affecting Death Rate Infant deaths per 1,000 live births <10 <10-35 <36-70 <71-100 <100+ Data not available • Life expectancy • Infant mortality rate (IMR)
Rate of Natural Increase Rate of natural increase = crude birth rate–crude death rate Developing Countries Developed Countries 50 50 Crude birth rate 40 40 Rate of natural increase Rate of natural increase Rate per 1,000 people © 2004 Brooks/Cole – Thomson Learning 30 30 Crude birth rate Crude death rate 20 20 Crude death rate 10 10 0 0 1800 2000 1775 1850 1900 1950 2050 1800 2000 1775 1850 1900 1950 2050 Year
Natural Rate of Increase Annual world population growth <1% 1-1.9% 2-2.9% 3+% Data not available 1% - triple in 100 years 2% - 7X in 100 years
Migration Rates • Affect regional populations • e.g., United States • Net gain of 4/1000 people/year • Add to 7 from BR - DR = 11 (1.1%)
Fertility Rates • Average number of children born to a woman during her childbearing years (ages 15-44) • Replacement level fertility rates for ZPG • Total fertility rates
Fertility Rates • Replacement level fertility rates for ZPG - developed countries - 2.1/woman - developing countries - 2.5 - total world - 2.3-2.4
Fertility Rates • Total fertility rates - developed countries - 1.9 (U.S. 1.8) - developing countries - 3.8 (Rwanda-8.5, Kenya-8.0) - total world - 3.4
Fertility Rates Births per woman < 2 4-4.9 2-2.9 5+ No Data 3-3.9
Fertility Rates • Time lag to ZPG - about 3 generations (~70 years) required to achieve ZPG once replacement level fertility rates are reached
Population Age Structure Male Female Rapid Growth Guatemala Nigeria Saudi Arabia Slow Growth United States Australia Canada Zero Growth Spain Austria Greece Negative Growth Germany Bulgaria Sweden Ages 0-14 Ages 15-44 Ages 45-85+
Average Marriage Age • or age at birth of first child • Higher marriage age leads to reduced reproductive period, which leads to lower fertility rates
Average Marriage Age • Current U.S. marriage age - 24 (F) • Reduces 30-year reproductive period (15-44) to 21-year reproductive period (24-44) - 30% reduction • Reduces 15-year prime reproductive period (15-29) to a 6-year prime reproductive period (24-29) - 60% reduction • Expectation: >25 needed to affect fertility rate
Current Needs for Large Families • Increased income • High infant mortality • Support for elderly • Few opportunities for women outside the home • Family planning unavailable
Can population growth be slowed? • Family planning • Economic development
Family Planning • Goal: help people have only as many children as they want, when they want them
Family Planning • Contraceptive methods - pills, devices, abortion (1 in 5 pregnancies terminated by abortion in world, 1 in 3 in U.S.)
Family Planning • Economic incentives, disincentives - direct incentives for contraceptive use, etc. - delayed incentives - old-age pensions - health insurance - free education for small families - penalties - extra taxes, reduce/withhold benefits for too many children
Family Planning • Increased women’s rights - jobs - education - shown to lead to lower fertility rates
Economic Development • Goal: encourage people to want fewer children • Stimulating economy influences demographics - demographic transition model - reduction in birth rate is ultimate goal
The Demographic Transition Stage 1 Preindustrial Stage 2 Transitional Stage 3 Industrial Stage 4 Postindustrial High 80 70 60 Birth rate 50 Birth rate and death rate (number per 1,000 per year) Relative population size 40 30 Death rate 20 10 Total population Low 0 Low growth rate Increasing Growth growth rate Very high growth rate Decreasing growth rate Low growth rate Zero growth rate Negative growth rate Time
Case Study: Slowing Population Growth in China (1.3 billion people) Generally positive results: begun in 1972 • Economic incentives • Free medical care • Preferential treatment • Intrusive and coercive • Locally administered
China’s Program: The Details -birth rate cut in half • Encourage later marriage (24-28 F, 26-30 M) • Family planning decentralized • Pledge benefits, penalties • Mandatory sterilization for >2 children) • Free contraceptives (IUD), sterilization abortion • 83% participation, fertility rate 5.7 to 1.7
Case Study: Slowing Population Growth in India (1.1 billion people) Generally disappointing results: • Poor planning (centralized) • Bureaucratic inefficiency • Low status of women (desire for male child) • Extreme poverty • Lack of support
India’s Program: The Details -no effect • Only 20% participation • Majority rural, illiterate (high fertility rate, high infant mortality) • 36% of population <15 years of age • Mid-1970s - voluntary sterilization! • 1978 raised minimum marriage age • Education to rural areas via satellite
Cutting Global Population Growth • Family planning • Reduce poverty • Elevate the status of women