Download

1 / 37
370 likes | 784 Vues
2. Chapter 5 Concept Map. . . . . . . . . Population Growth. Exponential growth. Density dependent factors. Carrying capacity. Density independent factors. Parasitism and disease. Competition. Predation. Demography. Immigration . Age structure diagram. Emigration. Logistic Growth. Limiting factors.

E N D
1. Chapter 5 Population Dynamics
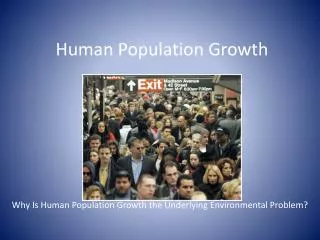
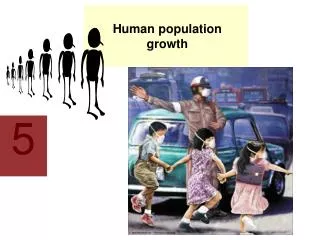
Human Population Growth
2. 2 Chapter 5 Concept Map
3. 3 Population Dynamics Populations often change size over time.
Some increase in size, others decrease.
We will concentrate on population growth:
How fast?
For how long will growth continue?
Population Density: # of individuals per unit area
4. 4 Population Dynamics Population growth can be linear:
5. 5 Population Dynamics Population growth can be exponential:
6. 6 Population Growth Exponential growth: when the number of organisms grows by a constantly increasing rate.
Ideal situation with unlimited resources.
Results in a population
7. 7 Population Dynamics R-selected: organisms that grow out of control, exponentially
Exponential growth can occur for short periods of time, but cannot continue forever!
Why?
What limits exponential growth?
8. 8 Population Dynamics Population growth can be logistic:
9. 9 Population Dynamics Carrying Capacity: The number of organisms of one species that a habitat or environment can hold
Once carrying capacity (k) is reached, the population maintains at that size.
These populations of organisms are called
k-selected.
10. 10 Population Dynamics
11. 11 Characteristics of K and R selected organisms K-selected organisms:
Big
Usually mammals (parental care)
Longer life span
Stable environments
Humans, bears, elephants
R-selected organisms:
Small bodied
Often insects
Short Life span
Mature early, lots of offspring
Mosquitoes, bacteria.
12. 12 Estimating Populations in Nature Random Sampling: counting organisms in a few small areas and projecting those counts for the entire area
Ex. if 10 squirrels live in a 200 ft2 area, then we might predict that 100 squirrels live in a 2000 ft2 area
What are some problems with this technique? What could affect its accuracy?
13. 13 Estimating Populations in Nature Mark-Recapture: capturing of live organisms, marking them, and releasing them back into the habitat
Organisms are recaptured and data is taken in regards to how many have already been marked or tagged
A mathematical formula is used to estimate population size
Estimate of Pop. Size = # captured x # marked
total # recaptured with mark
14. 14 Estimating Populations in Nature A biologist originally marks 40 butterflies. Over a month long period, she traps 200 butterflies. Of the 200, 80 were marked with tags. What is the estimate for butterflies?
15. 15 Limiting Factors: Biotic or abiotic factors that restrict or prevent the existence, numbers, reproduction, or distribution of organisms.
Ex. A predator such as a lynx is a limiting factor for a prey such as a hare.
Ex. A cold snowy winter is a limiting factor for thousands of species that would die under those conditions.
Ex. In brackish water, fish can�t pass from salt water to fresh water. The salinity of the water is a limiting factor.
16. 16 Population Dynamics Limiting Factors can be biotic or abiotic.
*List examples of each!
17. 17 Population Dynamics Density Dependent Factors: Factors that limit the size of a population and only exist when populations get too big
Ex. Disease, competition, parasites, and a limited amount of food.
These would not have caused so many problems had the population remained small.
18. 18 Population Dynamics Predation: One animal constantly consuming another, limits its� population size
Ex. Owls keeping a mouse population small, or hunters keeping deer numbers in check.
Ex: Lynx and Hare
Predator can�t eat all prey or food will be gone for good.
19. 19 Lynx Chases Hare
20. 20 Lynx and Hare Graph
21. 21 Population Dynamics Competition: A density dependent factor. Individuals competing for limited food source or other resources.
Crowding and Stress: Not completely understood, but causes:
fighting
Infertility
decreased parental care
decreased immunity to disease
death
Parasitism and Disease: parasites limit the growth of a population by causing diseases
22. 22 Population Dynamics Density Independent Factors: Limiting factors that would affect all populations regardless of size
Most are abiotic factors.
Ex. Floods, hurricanes, drought, habitat destruction.
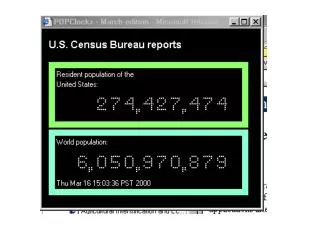
23. 23 Human Population Growth Demography: the study of human population growth characteristics.
Scientists called Demographers.
See Fig. 5.10 on p. 129 for graph of exponential human growth.
Demographic transition: a dramatic change in birth and death rates
24. 24 Human Population Growth Birth Rate: Usually it�s the number of babies that were born in the past year.
# of births in a sample size of 1000 individuals
Death Rate: Usually it�s the number of people who have died in the past year.
# of deaths in a sample size of 1000 individuals
25. 25 Human Population Growth Fertility Rate: The number of babies each woman is having during her fertile years.
26. 26 Human Population Growth Age Structure: can be used to determine how quickly a country or area is growing.
Are most individuals post-reproductive?
Are most individuals reproductive?
Are most individuals pre-reproductive?
Which of these would most likely be growing the fastest?
The slowest?
? ? ?Populations that are not growing have about the same numbers of each age group. ? ? ?
See p. Fig 5.13 pg. 131
Age Structure Diagram: population profiles, graphing the number of people in different age groups
27. 27
28. 28 Human Population Growth Immigration: movement by individuals into a country or area.
Emigration: movement by individuals out of a country or area.
Neither change world populations but both change populations of the countries involved.
29. 29 Important Study Tips! J-Shaped Curve/S-Shaped Curve/Linear
Carrying Capacity
R-selected/K-selected populations
Density Dependent/Independent Factors
Predation/Competition/Overcrowding and Stress
Demography
Birth/Death/Fertility Rate
Age Structure
Emigration/Immigration
30. 30
31. 31
32. 32
33. 33 Chapter 6 Review
34. 34 Population Dynamics Tree Map
35. 35 R-Selected Vs. K-Selected Double Bubble Map
36. 36 Dependent Vs. Independent Double Bubble Map
37. 37 Demography Thinking Map