Human Population Growth
Human Population Growth. Extinctions and Humans. Factors adversely affecting species are largely human-mediated and are occurring at an extremely rapid and accelerating rate. Smith et al. 2009. Ecology 90: 3279–3289. Population modelers use different methods to assess population growth.
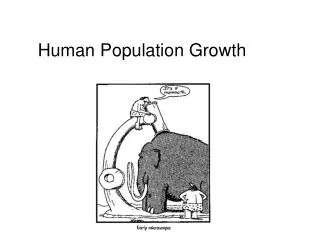

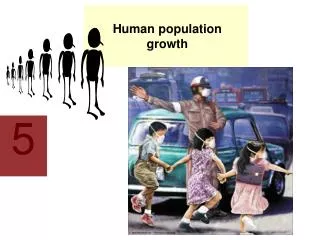
Human Population Growth
E N D
Presentation Transcript
Extinctions and Humans Factors adversely affecting species are largely human-mediated and are occurring at an extremely rapid and accelerating rate. Smith et al. 2009. Ecology 90: 3279–3289.
Population modelers use different methods to assess population growth. 1) exponential growth With exponential growth, the population rate of change (r) is constant through time, while growth of the population is geometric. There is no adverse feedback on population growth rate caused by increasing population size and its concomitant reduction in remaining resources
Exponential population growth cannot continue indefinitely because organisms experience some form of negative feedback. 2) logistic growth. Logistic growth adds this feedback term to the equation of growth rate: where a is an integration constant to define position on curve relative to origin
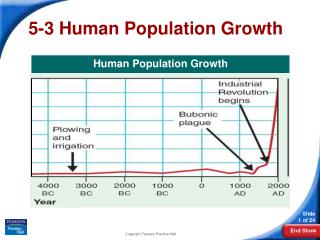
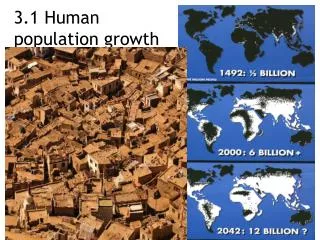
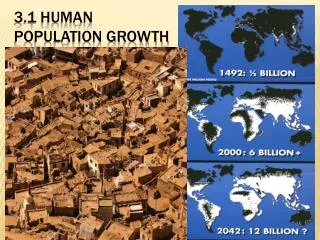
Human population growth is affected by natality and mortality rates. Throughout our history, mortality rates have kept population growth at a relatively low exponential growth rate of about 0.002% per year. Disease and famine were particularly important. Logistic Growth
Most of the increase has been due to compounding of growth and to lower death rates. Growth rates differ dramatically depending on whether the country is affluent: More Developed Countries [MDC] or poor Less Developed Countries [LDC] AIDS and other diseases may impact growth rate statistics in many countries, though particularly in LDC's because many of the infected people are females of child-bearing age.
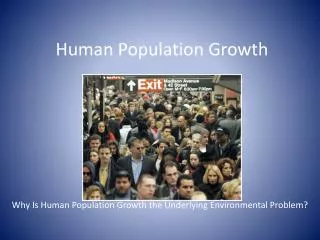
Why do we care so much about population growth? Simply put, each individual has an environmental ‘footprint’. More mouths necessarily mean a greater demand of environmental resources, but so does greater individual use of resources. For example, Postel et al. (1996) estimated that the global human population now utilizes 54% of water runoff that is geographically and temporally available. Of course, access to potable water varies tremendously on a global basis.
Vitousek et al. (1997) showed that application of nitrogenous fertilizers has increased dramatically since the 1940s; with other forms of human-mediated N-release, there has been a doubling of the nitrogen entering the land-based N-cycle. This increase has a adverse consequences including acid rain, loss of soil nutrients (Ca, K), smog, and eutrophication.
Thus, human population growth has very profound consequences for the characteristics of our environment. Our ecological ‘footprint’ has been calculated…
What are the leading hotspots? Tropical Andes Sundaland (Indonesia) Madagascar, Brazil's Atlantic forest Caribbean islands Each contains at least 2% of total plant biodiversity, or a total of 20% of all plants and 16% of all mammals. These regions are also among the world's most impacted by human activities.
There appeared to be pretty good correspondence between areas that were rich in plants and those rich in vertebrates. For example, areas rich in both plants and vertebrates included the Philippines and various northern African habitats, and the tropical Andes. Low correspondence was found for The Cape region of South Africa (rich only in plants - fynbos), and SW Australia (rich in Acacia and Eucalyptus ).
Obviously the type of stress applied by humans will differ from place to place. In the USA (and, almost certainly, Canada as well) the major stresses imperiling species are (Wilcove et al. 1998), in order: 1) habitat destruction and modification 2) nonindigenous species 3) pollution 4) overexploitation 5) diseases Didham et al. 2005. TREE 20: 470–475.
Sala et al. (2000) examined global ecosystems and the stresses expected to impact them over the next 100 years. In streams, tropical forests and southern temperate forests land use will be the major factor affecting change. In arctic and alpine ecosystems and boreal forests, climate change will be the leading factor. In northern temperate forests, nitrogen deposition will be most important. Lakes and Mediterranean regions will be most impacted by species invasions. 1 = land use 2 = climate 3 = nitrogen deposition 4 = biotic exchange 5 = atmospheric CO2
Independent of biome, by the year 2010 land use will be the most influential driver affecting changes in biodiversity.
References Balmford, A. 1996. Extinction filters and current resilience: the significance of past selection pressures for conservation biology. TREE 11:193–196. Cincotta et al. 2000. Human population in the biodiversity hotspots. Nature 404:990-992. Didham et al. 2005. Are invasive species the drivers of ecological change? TREE 20: 470–475. Hardin, G. 1968. The tragedy of the commons. Science 162:1243-1248. Groom et al. 2005. Principles of Conservation Biology. Sinauer, Sunderland, MA. Myers et al. 2000. Biodiversity hotspots for conservation priorities. Nature 403:853-858. Postel et al. 1996. Human appropriation of renewable fresh water. Science 271:785-788. Reid, W.V. 1998. Biodiversity hotspots. TREE 17: 275–280. Sala et al. 2000. Global biodiversity scenarios for the year 2100. Science 287:1770- 1774. Smith et al. 2009. A framework for assessing ecosystem dynamics in response to chronic resource alterations induced by global change. Ecology 90:3279–3289. Sisk et al. 1994. Identifying extinction risks. Bioscience 44:592-604. Vitousek et al. Human alteration of the global nitrogen cycle: causes and consequences. Issues in Ecology 1: 1-15. Wilcove et al. 1998. Quantifying threats to imperiled species in the United States. Bioscience 48:607-615.