Human population growth – Facts:
340 likes | 525 Vues
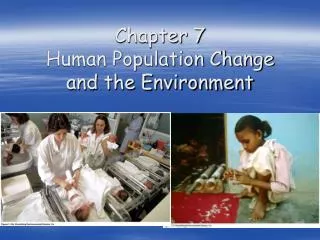
IS THIS OUR FUTURE? From TOLES The Buffalo News (Cunningham and Saigo 1999, p.138). Human population growth – Facts:. Every second an average of 4.5 children are born and 2 people die net gain = 2.5 people/second 9,000 people/ hour 216,000 people/day

Human population growth – Facts:
E N D
Presentation Transcript
IS THIS OUR FUTURE? From TOLES The Buffalo News (Cunningham and Saigo 1999, p.138)
Human population growth – Facts: Every second an average of 4.5 children are born and 2 people die net gain = 2.5 people/second 9,000 people/ hour 216,000 people/day 79 million people/year
100 yrs to reach 2nd(1925) 35 yrs to reach 3rd (1960) 15 yrs to reach 4th (1975) 12 yrs to reach 5th (1987) 12 yrs to reach 6th (1999) Kaufman and Franz 2000, p.156 It took 2 million years to reach 1 billion people (1825)
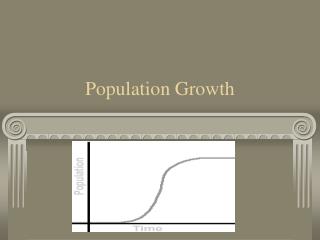
How did we get here? • 3 main strategies or circumstances • Expansion into new habitats • Increasing carrying capacity of habitats already inhabited • Removal of limiting factors
1 - Expansion into new habitats • Early humans limited to savannahs • Mostly gatherers of vegetables and scavengers of meat • By 200,000 ybp hunter/gatherers had appeared • By 40,000 ybp hunter/gatherers had spread through much of world Expansion was much more rapid than most animals And it was enabled by . . . ?
2 - Increasing carrying capacity of habitats already inhabited • 4 “revolutions” • Cultural = use of tools – questionable date Allowed more efficient hunting and gathering • Agricultural = domestication of animals and wild plants and irrigation ~10,000 ybp Increased food increased population towns and cities social hierarchy with division of labor more intensive ag increased food . . . • Industrial/technological ~ 1600 A.D. • Green = hybridization of crops (mid 1970s) , fertilizers, pesticides, insecticides and better irrigation (1950s on)
3 - Removal of limiting factors • Until middle ages the effect of high birth rate was cancelled out by disease, famine, war, cultural taboos, and conscious control of populations through practices such as infanticide • Technogical revolution led to germ theory 300 ybp • Bacteria and viruses recognized as disease agents • Development of vaccines, early antibiotics, disinfectants, better hygiene, sewage treatment, plumbing
So what is our carrying capacity? • Why is it difficult to know?
So what is our carrying capacity? • Why is it difficult to know? • No equation for K for humans – we can’t experiment to find out! • Geopolitical boundaries are not the same as environmental boundaries - K for one country is different from K for an other or for the globe • We can change our K • Do we want to determine human K based only on survival? • Brings up CULTURAL CARRYING CAPACITY
Cultural carrying capacity = the population size the environment can sustain over a long period of time with a given technology, standard of living, and associated pattern of living I = PAT Environmental impact = population X affluence X technology What is the world population’s ecological footprint?
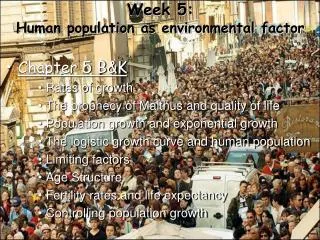
2 classic views of limits to growth: • Thomas Malthus – 1798 – An Essay on the Principle of Population as It Affects the Future Improvement of Society, with Remarks on the Speculations of Mr. Godwin, M. Condorcet, and Other Writers • To refute “progressives’ and optimists’” predictions of utopian society • Population grows geometrically, but food only grows slowly • Only way to stabilize population is by: • Positive decreases – disease and famine • Preventative – “moral restraint” • Most people are too lazy or immoral to voluntarily reduce population, so shouldn’t feed the poor
Karl Marx – vehement critic of Malthus A “shameless sycophant of the ruling class” believed that population growth was a symptom, not a cause, of social ills Population grow is caused by oppression and exploitation
Do these views still apply today? Still have classism, exploitation, etc. But, at some point human population growth has to be limited. Neo-Malthusians – think should address population problem directly and quickly, and birth control should be our highest priority Neo-Marxians – think only eliminating oppression and poverty through technology will solve population problems
1. Number of people 10 Most populous countries in 2025 (estimated, in millions) Country 1950 1995 2025 China 555 1221 1526 India 358 936 1392 US 152 263 331 Pakistan 39 140 285 Indonesia 79 198 276 Nigeria 33 112 238 Brazil 53 162 230 Bangladesh 42 120 196 Mexico 28 94 137 Ethiopia 18 55 127 How do we measure populations?
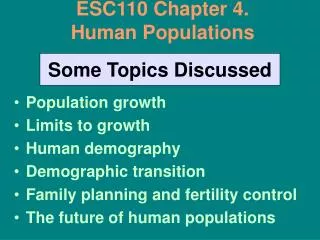
Demography = vital statistics about people = scientific study of the sum of individual acts as they affect population measures • Goal is to understand the causes and consequences of changes in population • Can help in planning • To understand significance of demographic statistics, must understand the culture
Factors affecting human population change births + immigration • Population change = minus deaths + emigration
Fertility = how many children a woman will bear in her life Crude birth rate = # of live births per 1,000 people Crude death rate = # of deaths per 1,000 people ZPG = zero population growth = when B+I = D+E Some demography definitions
Several important ones: Population density Urbanization Life expectancy Infant mortality rate Female literacy Countries with high and low fertility rates 10 highest 10 lowest Total fertility 7.25 1.4 Birthrate 49.8 10.4 Death rate 16.8 10.6 Annual increase 3.6 0.002 Infant mortality 111.1 10.8 Female literacy 24.5 > 95 GNP per capita $866 $13,049 What do demographic stats tell us about quality of life?
The demographic transitionBased on early industrial nations in Europe
Demographic transition in developed versus developing countries
So what implication does this have on the demographic transition of developing countries today? • Huge percentage of children – not yet into childbearing years • What will happen as they rise through the pyramid?
The demographic trap Falling living standards (due to rapid increase in population?) • reinforce high fertility rates • reinforces decline in living standards High birth rates + low death rates + huge backlog explosive population growth
So what can be done? • Regulation – government population policies • Pronatalist = encourages childbearing • Antinatalist = discourages childbearing • Family planning • Education