3.1 Human population growth
480 likes | 960 Vues
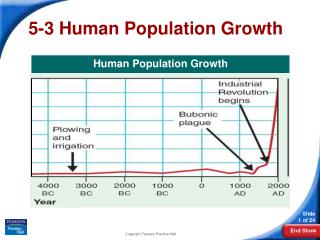
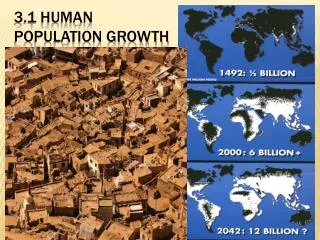
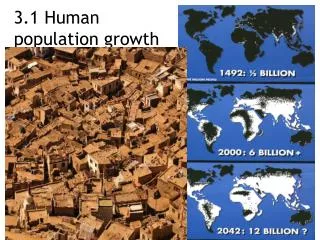
3.1 Human population growth. The Population Explosion – Exponential Growth. The Population Clock. Population Clock The global population reached 6 billion in fall of 1999 In 2013 Global Population Topped 7 billion!. Limiting factors of population Growth. Availability of food and water

3.1 Human population growth
E N D
Presentation Transcript
The Population Clock • Population Clock • The global population reached 6 billion in fall of 1999 • In 2013 Global Population Topped 7 billion!
Limiting factors of population Growth • Availability of food and water • Invasion of parasites, pathogens, or disease • Over-crowding • Sudden Climate changes • Pollution of air, soil and water • If we do not take steps to control population it is likely one of these factors will forcibly reduce our population for us!!
Humans Avoid Limiting Factors by… • Importing resources • Improving sanitation and medicine • Expanding habitat • Increasing capacity in existing habitats • Increasing in agricultural technology
Key Terms • Population:number of persons • Population change: a change (increase or decrease) in the number of persons (per year) • Growth rates: rate of change (per year) includes births, deaths and immigration, and emigration
Crude Birth Rate • Crude Birth Rate (CBR)= number of births per 1000 population • Example: US Births = 3,999,386 and the total population is 307,645,076 people • (Births / Total Population) x 1000
Crude Death Rate • Crude Death Rate (CDR)= number of deaths per 1000 population • Example: US Deaths = 2,468,435 and the total population is 307,645,076 people • (Deaths/ Total Population) x 1000
Natural Increase Rate (NIR)Rate of Natural Increase (RNI) • Rate Natural Increase is % growth rate based only on birth and death • (Totally ignores immigration and emigration) • RNI = (crude birth rate – crude death rate) 10 • Example: The CBR of USA is 13.0 and the CDR is 8.0. Calculate the RNI of USA
Fertility • General Fertility-(# live births / female reproductive population (15-44) x 1000 • Example: US Births = 3,999,386 and female population ages 15-44 is 62,071,000
Fertility Continued • Replacement Fertility: Number of children adults need to have to replace themselves • MEDC ~ 2.1 • LEDC ~ 2.3 + • TFR (total fertility rate) = • number of children born to a woman during her reproductive years (or life time) • USA TFR is 2.06 • Mali TFR is 7.38 !
Infant Mortality Rate • IMR (infant mortality rate) = • infant deaths per 1000 live births (infant < 1 yr) • Used as overall indicator of health
Doubling Time • Number of years in which a population doubles its size • Doubling time can be approximated using growth rates and the rule of 70 • Doubling time (T) = ___70_____ % growth rate Calculate Doubling Time Below • rate: 1.4% doubling time = 50 years • rate: 2.0% doubling time = ______ years • rate: 0.5% doubling time= _______ years • rate: -0.5% doubling time = _______years
Growth Rate • Human Population Growth Per Year = 1.4% • LEDC (least economically developed country)=1.7% • MEDC (more economically developed country) = 1.0%
Factors affecting fertility Rates • Urbanization • Importance of children in workforce • Cost of raising a child • Education/Employment for women • Average age of marriage • Availability of abortion • Availability of birth control • Religious beliefs, traditions and culture
Determining Future populations • Use Ne(rt) formula • N= Current population • e= constant 2.71828… • r = growth rate as a decimal!!! (Divide by 100!) • t = time in years • Example: 2010 data reports that a population of 2,350,000 has a growth rate of 1.2%. What will the population be in 2025?
Carrying Capacity • The maximum population that can be sustainably supported without running out of resources.
What is a Population Pyramid? • Graphic device: bar graph • Shows the age and gender composition of a region • Horizontal axis: gender • male: left-hand female: right-hand • absolute number of people or % • Vertical axis: age • 5-year or 10-year age groups • Three age population categories • Pre Reproductive- (0-14) • Reproductive- (15-44) • Post Reproductive- (45 +)
Why a population Pyramid? • Helps to determine specifics of potential future populations • Shape of pyramid indicates future growth • Can point to future changes in social conditions of a country
Reason for changes in the DTM • Birth rates, death rates and growth rates systematically change through time as societies change: • Modernize, urbanize • Gain access to new technology • Births, deaths, migration • Fertility rates play huge role
Stage 1 • High birth rates, high death rates, low growth rates • Stage for much of human history, traditional societies • Practically no country today
Stage 2 • High birth rates, declining death rates, rising growth rates • Improvements in sanitation (water) and medicine • Europe during Industrial Revolution • LEDC countries since the 1950’s • Much of Africa today, some countries of Asia (Afghanistan, Nepal)
Stage 3 • Continued decline of death rates, declining birth rates, growth rates decline from high to lower levels • Change in behavior: adaptation to lower death rate, in particular infant mortality rate • Economic change: urbanization (incentive to have fewer children) • Mexico today
Stage 4 & 5 • Stage 4: low birth rates, low death rates, low growth rates • United States today • Stage 5: low birth rates, rising death rates, declining growth rates (if birth rates drop below death rates: negative growth rates) • Western Europe, Japan
Population Pyramid and Demographic Transition • Stage 2: wide base
Population Pyramid and Demographic Transition • stage 3: wide middle
Population Pyramid and Demographic Transition • stage 4: slender
Population Pyramid and Demographic Transition • stage 5: narrow base
Models for Predicting Population growth • Computer simulations: • Can be highly accurate with many variables • Cant include unforeseen events (i.e. natural disaster, terrorist strike, warfare)? • Statistical and/or demographic tables • Include actual field measurements based on past trends. • Past trends may not always predict future trends. • How large/representative are the sample populations? • Age/sex pyramids ( • see above) • Population curves • Mathematical extrapolation from graphs based on real data • Less complex than computer models