Download
1 / 42
440 likes | 960 Vues
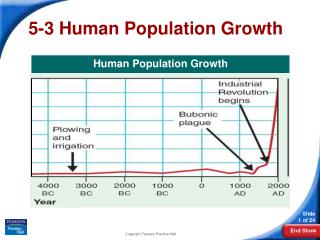
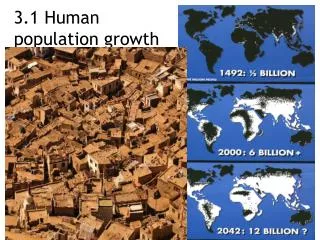
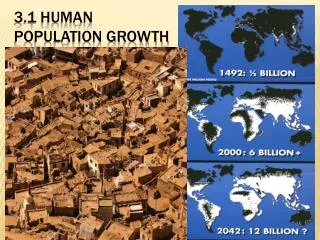
3.1 Human population growth. The Population Explosion – Exponential Growth. Population Clock http://www.census.gov/main/www/popclock.html The global population reached 6 billion in fall of 1999. The Population Clock. Expansion of habitat Increased capacity in existing habitats

E N D
Population Clock http://www.census.gov/main/www/popclock.html • The global population reached 6 billion in fall of 1999 The Population Clock
Expansion of habitat • Increased capacity in existing habitats • Importing resources • Improved sanitation and medicine • Increase in agricultural technology Reasons for population explosion
Availability of food and water Invasion of parasites, pathogens, or disease Over-crowding Sudden Climate changes Pollution of air, soil and water If we do not take steps to control population it is likely one of these factors will forcibly reduce our population for us!! Limiting factors of population
Population: number of persons Population change: increase in the number of persons (per year) Growth rates: rate of change (per year) includes births, deaths and immigration, and emigration Population, population change, growth rates
Crude Birth Rate (CBR)= number of births per 1000 population • 1990: 24 Today: 21.3 • Crude Death Rate (CDR)= number of deaths per 1000 population • 1990: 9 Today: 8.93 • Rate Natural Increase is % growth rate without migration • RNI = (crude birth rate – crude death rate) 10 • 1990: 1.5% Today: 1.4% • growth rates have come down measuring POPULATION Growthuse: International Data Base http://www.census.gov/ipc/www/idbnew.html, then Online Demographic Aggregation
Number of years in which a population doubles its size • Doubling time can be approximated using growth rates and the rule of 70 • Doubling time (T) = ___70_____ % growth rate Calculate Doubling Time Below • rate: 1.4% doubling time = 50 years • rate: 2.0% doubling time = ______ years • rate: 0.5% doubling time= _______ years • rate: -0.5% doubling time = _______years Doubling Time
Human Population Growth Per Year = 1.4% LEDC (least economically developed country)=1.7% MEDC (more economically developed country) = 1.0% Growth Rate
TFR (total fertility rate) = • number of children born to a woman during her reproductive years (or life time) • 1990: 3.1 2000: 2.8 • IMR (infant mortality rate) = • infant deaths per 1000 live births (infant < 1 yr) • Used as overall indicator of health • 1990: 62 2000: 56 (1900: 200) Special Kinds of Fertility and Mortality Rates
Use Ne(rt) formula • N= Current population • e= constant 2.71828… • r = growth rate as a decimal!!! • t = time in years • Example: 2010 data reports that a population of 2,350,000 has a growth rate of 1.2%. What will the population be in 2025? Calculating Future population
The maximum population that can be sustainably supported without running out of resources. Carrying Capacity
Graphic device: bar graph • Shows the age and gender composition of a region • Horizontal axis: gender • male: left-hand female: right-hand • absolute number of people or % • Vertical axis: age • 5-year or 10-year age groups • Three population categories • Pre Reproductive- (0-14) • Reproductive- (15-44) • Post Reproductive- (45 +) Population Pyramids
Helps to determine specifics of potential future populations Shape of pyramid indicates future growth Can point to future changes in social conditions of a country Why a population Pyramid?
Birth rates, death rates and growth rates systematically change through time as societies change: • Modernize, urbanize • Gain access to new technology • Births, deaths, migration • Fertility rates play huge role Five Stages of the Demographic Transition
Urbanization Importance of children in workforce Cost of raising a child Education/Employment for women Average age of marriage Availability of abortion Availability of birth control Religious beliefs, traditions and culture Factors affecting fertility Rates
High birth rates, high death rates, low growth rates Stage for much of human history, traditional societies Practically no country today Stage 1
High birth rates, declining death rates, rising growth rates Improvements in sanitation (water) and medicine Europe during Industrial Revolution LEDC countries since the 1950’s Much of Africa today, some countries of Asia (Afghanistan, Nepal) Stage 2
Continued decline of death rates, declining birth rates, growth rates decline from high to lower levels Change in behavior: adaptation to lower death rate, in particular infant mortality rate Economic change: urbanization (incentive to have fewer children) Mexico today Stage 3
Stage 4: low birth rates, low death rates, low growth rates • United States today • Stage 5: low birth rates, rising death rates, declining growth rates (if birth rates drop below death rates: negative growth rates) • Western Europe, Japan Stage 4 & 5
Stage 2: wide base Population Pyramid and Demographic Transition
stage 3: wide middle Population Pyramid and Demographic Transition
stage 4: slender Population Pyramid and Demographic Transition
stage 5: narrow base Population Pyramid and Demographic Transition
Computer simulations: • Can be highly accurate with many variables • Cant include unforeseen events (i.e. natural disaster, terrorist strike, warfare)? • Statistical and/or demographic tables • Include actual field measurements based on past trends. • Past trends may not always predict future trends. • How large/representative are the sample populations? • Age/sex pyramids( • see above) • Population curves • Mathematical extrapolation from graphs based on real data • Less complex than computer models Models for Predicting Population growth