Download
1 / 30
300 likes | 420 Vues
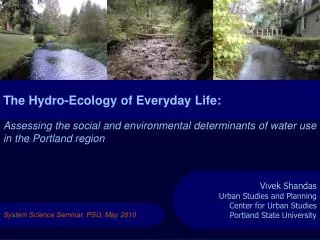
The Hydro-Ecology of Everyday Life:. Assessing the social and environmental determinants of water use in the Portland region. Vivek Shandas Urban Studies and Planning Center for Urban Studies Portland State University. System Science Seminar, PSU, May 2010.

E N D
The Hydro-Ecology of Everyday Life: Assessing the social and environmental determinants of water use in the Portland region Vivek Shandas Urban Studies and Planning Center for Urban Studies Portland State University System Science Seminar, PSU, May 2010
How many Olympic size swimming pools does it take to quench the thirst of people living in the Portland metropolitan region for one day? (Hint: One Olympic Size Swimming Pool contains: 2,500 m3 or 660K Gallons) Almost 408! At current rates of population growth and water use, by 2040 the region will consume the amount of water equivalent to Crater Lake.
Water as the New Carbon? • “Water flows uphill towards money.” • Marc Reisner, Cadillac Desert, 1986 • Headline news: • “Water Shortages: Atlanta's Cup Nearly Runneth Out” -- The NY Times (2008) • “Large companies not prepared for water shortage” – Bussiness Week (2007) • Water rationing is possible this summer: Light snowpack, low reservoirs creates shortages in California. – LA Times (2007) • “Shortage of water brings restrictions” – St.Petersburg (2006)
Background – the Problem • Population growth in the NW • Climate destabilization and variability – supply side focus with limited empirical evidence on demand measures • Limited coordination between land use planning and water resource management • Water demand management without info on the impact of land use patterns • Land use planning without consideration of water demand
Residential Land Use Residential Development: 1990 - 2000 Residential Dwelling Density: 2005
Study Objectives • Assess the role of urban form in water use • Investigate what factors explain patterns of water use (demand focus) • Examine the effects of temperature change on water use
Conceptual Model Coupling of Human and Environmental Systems Structural Building area, zoning, pricing scheme, urban growth, etc. Environmental Conditions Temperature Precipitation Droughts Total Water Consumption Household, Neighborhood, Region, State, Country, Globe Societal Neighborhood, demographics, cultural, biophysical, etc. Individual Preferences, habits, life stage, financial, etc.
Bull Run Watershed • Portland's planning policies: • No Requirement to ensure adequate water supply • Goal 2, of the Portland's land-use plan identifies `water' as an infrastructure subsystem • Bull Run Watershed • 102 square miles, Cascade Snowmelt snowmelt • Started in January 1895 consisted
Case Study Portland Water Bureau • Serves 19 water providers of the region • 802,000 residents served total, retail service 539,200 • This study focused on Portland’s retail service area only • 149,000 residential accounts • 30,000 commercial and industrial accounts
Data and Methods • Water use (PWB) (1) Yearly: for all taxlots (1999 – 2005) (2) Daily: 501 SFR taxlots • Land use (Metro) • Structural attributes, building age, address • Daily temperature (OSU) • Demographic data (US Census) • Income, education • Arial photos (City of Portland) • Canopy cover – parcel scale • GIS and statistical methods • GIS: to integrate structural and societal characteristics • OLS, pooled-cross section, and hierarchal statistical models to assess relationships
Three Analysis to Address Objectives • Analysis of land use building area with annual water consumption • Provides evidence about the role of land use planning on water demand management • Analysis of residential and neighborhood development patterns and annual water consumption • Provides evidence about the role of urban form in water demand management • Analysis of historic and projected daily maximum temperatures with water use • Provides evidence about the impact of climate change on water demand management
Results: Pooled Cross Section • Zoned and Building area • Overall explanatory power (R2) is improved • Zoned area and building are coefficients vary • MFR and SFR have similar building area water use coefficients
High water use neighborhood Water use per household Residential water use is affected by land development characteristics Water use (acre/ft) Building size (ft2/1000)
Parcel Level SFR Water Use Low High
Low High
Results: Temperature Analysis 2 • Seasonal patterns are strong • Threshold increase in water use occurring at 690F
Results: Temperature Analysis 1 • Temperature as predictors of water use • Noisy data linking temperature to water use • Water use becomes more varied as daily max temperatures rise • Maximum and weekend explain almost 75% of water use
Understanding Water Use Dynamics Climate Scenarios Temperature Maximum, Timing Driver Alternative Development Patterns Structural Building area, density, age Pattern Total Water Consumption Household, Neighborhood Predications of Climate-Induced Water Demand Effect
Seasonal Changes in Water Use • Change in water use between coldest day and warmest day (2001, census block geography)
Future Climate Scenarios • Climate Impact Group’s IPSL_CM4 A2 used to examine model accuracy for 2001: suggest 98% accuracy
Future Climate Scenarios • What is the potential change in SFR water use based on down-scaled climate models of the PNW? • Modeling water use (based on predicted temperature) through 2020
Forecasting Changes in Water Use • Using only results from temperature data • Percent change in water use from 2001 – 2040 (IPSL)
Implications of Climate Change on Residential Water Use • Scenario: An 80F day in a development containing 100 new houses (4K sqft) • For an average house (~ 2K square feet), each additional 1000 square feet of SFR house creates an additional water demand of 82 gallons • Compounded by temperature • These houses are about 2000 square feet larger than the average house in the Region, and 10 degrees above the 700F degree threshold. • The combined impact of this new development is approximately 20,900 gallons per day, which is approximately the amount of water stored in a typical household swimming pool • The role of Land Use Planning • An additional 25% reduction in the average building size – a reduction from 2,800 ft2 to 2,100 ft2 in the study region – • Annual saving of 6.6 million gallons of water. • For a new residential development of 100 SFR units, annual decrease of 651 million gallons per year -- 1000 Olympic size swimming pools.
Implications of Coupling Water and Land Use Management Research • Short term: Urban form, such as housing density and building size, need to be considered when planning for water demand. • Develop models that link alternative urban land use patterns and temperature scenarios to predict differences in water demand • Identify thresholds of population growth, land use patterns and temperature regimes that combine to • Long term: We need to develop mechanisms for better coordinating land and water use management, especially in the urban and urbanizing areas • Compare and contract findings from Portland (OR) with other urban regions in the United States • Linking climate-induced water demand with expected changes to water supplies will improve society’s capacity for predicting future water needs • Collaborate with regional managers to identify and evaluate policies for better coordinating water and land use policies
Papers for Reference • Shandas, V., and GH Parandvash (2009). Integrating Urban Form and Demographics in Water-Demand Management: An empirical case study of Portland, OR. Environment and Planning B, Vol 35 (1) • Chang, H., GH Parandvash, and V Shandas (2010).Spatial Variations of Single Family Residential Water Use in Portland, Oregon, Urban Geography • Shandas, V., M Rao, and MM McGrath (under review). The implications of climate change on residential water use: A micro-scale analysis of Portland (OR). Journal of Water and Climate Change
Acknowledgements and Contact Info Portland State University Heejun Chang Geography Meenakshi Rao Environmental Science and Management Portland Water Bureau G. Hossein Parandvash Principal Economist Contact Information Vivek Shandas vshandas@pdx.edu http://web.pdx.edu/~vshandas/