Download
1 / 16
160 likes | 266 Vues
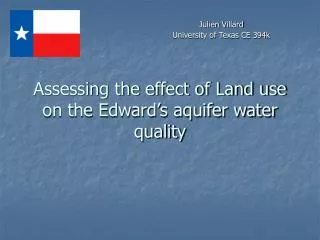
Assessing the effect of Land use on the Edward’s aquifer water quality. Julien Villard University of Texas CE 394k. Facts about the Edward’s aquifer 22 to 55 million acre-feet Head drop > 1 foot/day Increased environmental concerns: Urban sprawl Overdrafting.

E N D
Assessing the effect of Land use on the Edward’s aquifer water quality Julien Villard University of Texas CE 394k
Facts about the Edward’s aquifer • 22 to 55 million acre-feet • Head drop > 1 foot/day • Increased environmental concerns: Urban sprawl Overdrafting Municipal wells in San Antonio, 1895
Contamination sources 85% 15% • Agricultural areas • Fertilizers, farming, animal dejections • Urban areas • Domestic sewage, storm water runoff • Industrial areas • Organic industrial wastes
Well location shapefile Selection by location Selection by attribute “Water_Qual”=“Y” My new shapefile
Water quality data Sulfate, Chloride, Fluoride, Nitrate, TDS Travis, Hays, Comal, Bexar, Medina, Uvalde, Kinney
Sulfate 2003 Nitrate 2003 Fluoride 2003 Chloride 2003
USGS Land use data • Land cover classification system • Urban • Low residential • High residential • Industrial • Commercial Industrial • Agricultural • Pasture • Row crops • Small grains • Fallow
Density rasters Urban density % Agricultural density%
Results • Urban areas
Results • Agricultural areas
Results • Crop areas
Results Selection of points at less than +/- 5% off the straight line
Conclusion • No apparent correlation between land use and fluoride, sulfate. • Small trend between nitrate concentration and land use in the recharge area. • Recharge area more sensitive to land use?
Any Questions? My brother was having fun while I was preparing my slides