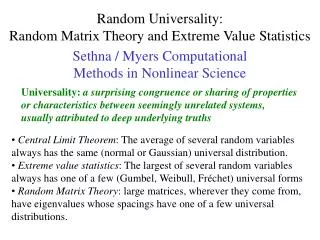
Random Matrix Theory in a nut shell.
3. Spectral statistics. Random Matrix Theory in a nut shell. Eigenvalues distribution:. Graphs: the spectrum and the spectral statistics. GUE. GOE. The random G (V,d) ensemble. Spectral 2-points correlations:. ( mapping the spectrum on the unit circle). Why do random graphs display the

Random Matrix Theory in a nut shell.
E N D
Presentation Transcript
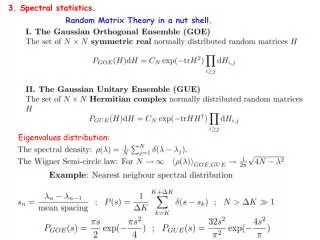
3. Spectral statistics. Random Matrix Theory in a nut shell. Eigenvalues distribution:
GUE GOE The random G(V,d) ensemble
Spectral 2-points correlations: (mapping the spectrum on the unit circle)
Why do random graphs display the canonical spectral statistics? Counting statistics of cycles vs Spectral statistics The main tool : Trace formulae connecting spectral information and counts of periodic walks on the graph The periodic walks to be encountered here are special: Backscattering along the walk isforbidden. Notation: non-backscattering walks = n.b. walks
Spectral Statistics Two-point correlation function. However: the spectral variables are not distributed uniformly and to compare with RMT they need unfolding
The (not unfolded) Spectral formfactor # t-periodic nb cycles Spectral form factor = variance of the number of t-periodic nb - walks For t < logV/log (d-1) C_t are distributed as a Poissonian variable Hence: variance/mean =1 (Bollobas, Wormald, McKay)
V=1000 V=1000 d=10