Download
1 / 17
170 likes | 384 Vues
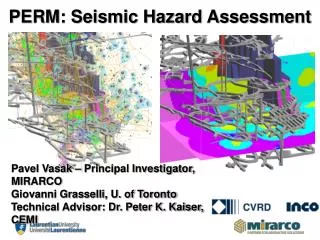
National Seismic Hazard Maps and Uniform California Earthquake Rupture Forecast 1.0. National Seismic Hazard Mapping Project (Golden, CO) California Geological Survey (Sacramento, CA) Ken Campbell (EQECAT). http://earthquake.usgs.gov/hazmaps/. Western U.S. Hazard Model. A and B faults.

E N D
National Seismic Hazard Maps and Uniform California Earthquake Rupture Forecast 1.0 National Seismic Hazard Mapping Project (Golden, CO) California Geological Survey (Sacramento, CA) Ken Campbell (EQECAT) http://earthquake.usgs.gov/hazmaps/
A and B faults Characteristic G-R 0 weight A-faults: 1.0 weight B-faults: 2/3 weight 1/3 weight
2 mm/yr, M 6.5-7.3 strike=-25 b=0.8 Surprise Valley 1.3 Hat Creek, McCarther, Cedar Mtn 1-1.5 mm/yr 2 mm/yr M 6.5-7.3 strike=-45 b=0.8 Honey Lake 2.5 mm/yr 4 mm/yr M 6.5-7.3 strike=-45 b=0.8 0.05 mm/yr M 6.0-7.0 strike=-35 b=0.9 1 mm/yr Genoa Antelope V. 4-5 mm/yr Death Valley White Mountains
Time-independent 2002 NSHM • 1996 faults with a few modifications • WGCEP 2002 rates for S.F. Bay area faults • Southern San Andreas (moment balanced) • Model 1 paleoseismic rate model: Weights assigned so the total rates of large earthquakes on given segments consistent with observed paleoseismic rates. Magnitude determined from magnitude-area relations, moment rate from slip rate and fault area, recurrence rates determined by dividing the moment rate by seismic moment of scenario earthquake. • 5 independent single segment ruptures (wt=0.1) • 1857 and southern S.A. ruptures (wt=0.5) • Complete rupture of all 5 segments (wt=0.4) • Model 2 Characteristic slip model: Uses SCEC Phase 2 slip and rates. Carrizo rate = 1857 rate (4.7e-3/yr), 4.75 m displacement (SCEC Phase 2), leftover slip rate on Mojave (9 mm/yr, 4.4 m event) and Cholame (12 mm/yr, 4.75 m event); Coachella+San Bern., M 7.7 event and slip rate and rupture area gives recurrence rate of 5.5e-3).
TIME-DEPENDENT SEGMENTATION MODELS Petersen et al. 2002 Geologic model WGCEP 2002 Legacy models MODEL 3 MODEL 2 MODEL 1
New time-dependent models • Legacy Model 1: Applied to time-independent model 1 (paleoseismic rate model). Probability gains are averaged for all segments involved in multi-segment ruptures. • Legacy Model 2: Applied to time-independent model 2 (characteristic slip model). Total time-dependent rate of earthquakes on Carrizo defined as 1857. Leftover rate put on single segment ruptures. • Geologic model: 2 complete rupture models (single segment and multi-segment ruptures). Single segments based on typical methods of calculating probabilities (wt 10%), multi-segment ruptures based on Weldon et al. characteristic type model (wt 90%).
From Weldon et al.: Rupture scenarios for the Southern San Andreas fault. Vertical bars represent the age range of paleoseismic events recognized to date, and horizontal bars represent possible ruptures. Gray shows regions/times without data. In (A) all events seen on the northern 2/3 of the fault are constrained to be as much like the 1857 AD rupture as possible, and all other sites are grouped to produce ruptures that span the southern ½ of the fault; this model is referred to the North Bend/South Bend scenario. In (B) ruptures are constructed to be as varied as possible, while still satisfy the existing age data. TIME-DEPENDENT ANALYSIS FOR SOUTHERN SAN ANDREAS : MODEL 3 Two multi segment rupture models based on Weldon et al. 2002
Lognormal density function: defined by sigma and mu-hat which is The median recurrence. ,
TIME-DEPENDENT ANALYSIS FOR SOUTHERN SAN ANDREAS : MODEL 1 Segment probability gain Multi-Segment probability gain The time-dependent 30-year probabilities for the five segments Coachella, San Bernardino, Mojave, Carrizo, and Cholame are 0.325, 0.358, 0.342, 0.442, and 0.512 assuming a lognormal distribution. The equivalent annual rates are calculated using the formula r = -ln(1-p)/t, where p is the segment time-dependent probability in t (30 years). This rate is divided by the Poissonian rate of the 2002 model and produces the probability gain for each segment. The gains for five segments are 1.141, 1.918, 1.065, 1.690, and 1.114. The weighted gain for this 5-segment rupture is 1.384 (= (0.325x1.141 + 0.358x1.918 + 0.342x1.065 + 0.442x1.690 + 0.512X1.114)/ (0.325 + 0.358 + 0.342 + 0.442 + 0.512)). The final annual rate for this rupture is the Poissonian rate (0.00355) multiplied by this gain and the 2002 model weight (0.4), which is 0.00196 (= 0.00355x1.384x0.4).
TIME-DEPENDENT ANALYSIS FOR SOUTHERN SAN ANDREAS : MODEL 2 We apply these different mean recurrence times and the same elapse times and intrinsic and parametric uncertainties and calculate time-dependent 30-year probabilities and their equivalent annual rates as we did in model 1. These rates are 0.008260, 0.010336, 0.008908, 0.007396, and 0.011173 for the segments: Coachella, San Bernardino, Mojave, Carrizo, and Cholame respectively. The Carrizo segment in T.D. model 2 only ruptures in 1857 type of events, so the time-dependent annual rate for 1857 type of rupture is defined as the rate for Carrizo segment (0.007396). The Cholame and Mojave segments are allowed in 2002 model to rupture independently. The time-dependent rates for these two segments are their time-dependent rates, which are converted from their 30-year probabilities, subtracted by the rate for 1857 type events or 0.003777 (= 0.011173 – 0.007396) for Cholame and 0.001512 (= 0.008908 – 0.007396) for Mojave ruptures.
0 weight A-faults: 1.0 weight 1/3 weight B-faults: 2/3 weight Recurrence: moment of characteristic earthquake/moment rate of fault
Time-dependent model applied to A-faults Petersen et al. 2002 WGCEP 2002 Cramer et al. 2000 Frankel et al. 2002