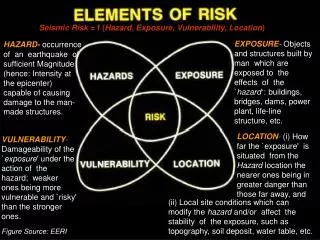
Seismic Hazard Maps
Seismic Hazard Maps. Art Frankel U.S. Geological Survey Seattle, WA. U.S. National Seismic Hazard Maps. Seismic hazard assessment integrates what we know about earthquake sources, faults, deformation, and ground motions STICK CLOSE TO THE DATA!. Geologic mapping, fault slip rates


Seismic Hazard Maps
E N D
Presentation Transcript
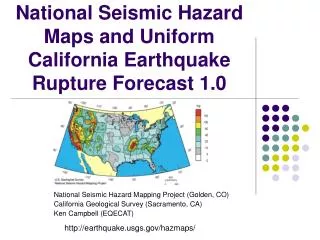
Seismic Hazard Maps Art Frankel U.S. Geological Survey Seattle, WA
Seismic hazard assessment integrates what we know about earthquake sources, faults, deformation, and ground motions STICK CLOSE TO THE DATA! Geologic mapping, fault slip rates EQ chronologies from paleoseismology potential fields, seismic reflection/refraction Earthquake catalogs (instrumental and historical), source parameters, ANSS National Seismic Hazard Maps (probabilistic seismic hazard assessment) Photo from Nelson et al. (2003) Seismograms: weak and strong motion (ANSS, CGS) peak and spectral amps Crustal deformation measurements (GPS, VLBI) From Benz et al. (1997) From Thatcher et al. (1997)
M 7.6 Hazard Methodology Example a b Earthquake Sources a Ground motion Hazard curve r1 d1 d4 annual probability of exceeding pga peak ground acceleration r2 d2 M7.6 d3 high seismicity zone San Andreas fault 0.25g 0.5g distance peak ground acceleration (pga) r3 Specify recurrence rates of earthquakes for each source that can affect site of Interest Time independent or time dependent Attenuation relations tell you median ground motions that each potential earthquake will produce at site, and variability Derived from strong-motion data (WUS) or models (CEUS). Can include site amp and 3D sedimentary basin effects Hazard curve: describes probability of having ground motions ≥ a certain intensity We use mean hazard curves from logic trees with alternative models
Annual probability of having ground motions larger than some specified value U = annual probability of earthquake occurring X probability of having ground motions larger than U when earthquake occurs
From Hazard Maps to Building Codes 1994-1996 USGS develops national seismic hazard maps with input from external community Building Seismic Safety Council develops design procedure to apply to hazard maps, published in 1997 NEHRP Provisions (FEMA) International Code Council adopts design procedures for 2000 IBC and IRC (also adopted in ASCE 7) We provided maps and hazard curves for a wide range of probabilities (science) Engineers chose design values of 2/3 of ground motions with 2% PE in 50 years, except in areas with Sa 0.2 sec > 150%g deterministic values are used (engineering) Merging of UBC, SBC and BOCA codes into IBC More details on hazard map methodology and design procedure are given in Earthquake Spectra February 2000 issue
Some of the other uses of the national seismic hazard maps and their input data • AASHTO standards for bridge design • FEMA national loss estimation (HAZUS) • Earthquake insurance premiums • EPA landfill regulations • Investment decisions The maps are a flagship product of the USGS and the National Earthquake Hazards Reduction Program
Included hazard from 450 Quaternary faults;Used recurrence rates determined from fault slip rates and/or chronologies of prehistoric large earthquakes from paleoseismology (trenching of faults, coastal subsidence, liquefaction)
Different locations for eastern edge of Cascadia subduction zone used in the national seismic hazard maps
Cedar trees killed by subsidence from the 1700 Cascadia subduction zone earthquake. Photo from Brian Atwater
Algermissen et al. (1990) 50 30 30 PGA (%g) with 2% PE in 50 years
Note floor of hazard values from large background zones; quantify hazard in areas with low historic seismicity but potential for large quakes
1999-2009 1999-2009 Did You Feel It 1,270,723 Response in 15,052 ZIP codes and 5983 Cities One of the U.S. National Seismic Hazard Maps
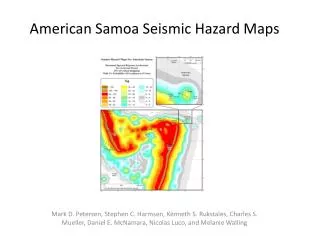
Seismic Hazard Maps for Haiti Frankel, S. Harmsen, C. Mueller U.S. Geological Survey E. Calais and J. Haase Purdue University
Components of Haiti Hazard Maps • Major crustal faults: Enriquillo-Plantain Garden, Septentrional, Matheux Neiba; use slip rates estimated from modeling GPS velocities • Subduction zones: northern subduction zone and Muertos Trough; use slip rates estimated from GPS measurements and overall plate motion • Spatially-smoothed shallow seismicity (0-40 km depth). Gaussian smoothing function, correlation distance of 50 km (used for all depths) • Spatially-smoothed deeper seismicity (40-100 km depth) • Spatially-smoothed deep seismicity (> 100 km depth)
Low level of recent M4-5 earthquakes along a fault is not an indicator of low hazard. The Enriquillo Fault in Haiti prior to the Jan 12th M7.0 earthquake is an example. Figure from Eric Calais, Purdue Univ. Map of seismicity since 1900 Figure from C.S. Mueller, USGS Observed rate of M>=4.0 since 1963 in 70 km wide box around Enriquillo Fault implies 1700 yr recurrence time for M>=7.0, for GR with b=1
Haiti seismic hazard maps, PGA with 10% Probability of Exceedance in 50 Years Yellow: 8-16%g New hazard map based on fault slip rates from GPS, historical and recent seismicity. Paleoseismology will provide key info on recurrence rates and magnitudes Hazard map from Global Seismic Hazard Assessment Program (GSHAP) 1999 based on recent seismicity
Slip rates determined from GPS by Calais et al. (2010) and Manaker et al (2008), except for NE subduction zone
Site conditions (Vs30) inferred from topographic slope using method of Wald and Allen, 2007
Used non-linear amplification factors from NGA within the PSHA integral Applied Boore and Atkinson (2008) nonlinear amp Factors to subduction zone GMPE’s Factors are functions of Vs30 and rock PGA
Current and Future Work to Improve Haiti Hazard Maps • Trench Enriquillo-Plantain Garden fault to determine rate of large earthquakes, magnitudes, slip rate; were 1751 and 1770 earthquakes on the main fault (note Prentice et al., 2010)? • Distribute some hazard away from main fault traces to account for Leogane fault and similar faults (also in smoothed seismicity) • More trenching of Septentrional fault to determine paleoearthquake history, slip rate • Characterize slip rate for Matheux Neiba fault • Include detailed site condition map for Port-au-Prince and other cities • Develop GMPE’s for Hispaniola (McNamara et al., submitted, determined regional Q)
Urban Seismic Hazard MapsSeattle hazard maps; USGS OFR 07-1175; Frankel, Stephenson, Carver, Williams, Odum, Rhea
1 Hz amp from Nisqually Earthquake From 19 events M2.7-4.8 From M6.8 Nisqually EQ
N S-wave velocity model used in finite-difference simulations. Model developed by Bill Stephenson
Nisqually EQ seismograms; 0.67- 1.33 Hz basin surface waves
541 3D finite-difference simulations used in Seattle seismic hazard maps • 458 simulations for earthquakes in Seattle fault zone (M6.6-M7.2) • 9 simulations for earthquakes on Southern Whidbey Island fault • 10 simulations for point sources on Cascadia subduction zone • 48 simulations for shallow earthquakes: 8 azimuths, 3 distances and two depths (10 and 15 km) • 16 simulations for deep earthquakes (50 km depth): 8 azimuths and 2 distances • Calculated synthetics at 7236 sites, with 280m spacing • Used about 7.8 million synthetic seismograms • 3D finite difference code written by Pengcheng Liu
Float rupture zones along Seattle fault traces, do nine 3D simulations for each rupture zone (3 slip distributions, 3 hypocenters) 37 rupture zones M6.6-M7.2 on each of three fault traces, two dips
1 Hz Spectral Acceleration (%g) with 2% chance of being exceeded in 50 years one of 2002 national seismic hazard maps; rock site condition Using 3D simulations and nonlinear ampl. for fill/alluvium Using 3D simulations with basin effects and directivity
Unreinforced Masonry Building locations in Seattle plotted on USGS urban seismic hazard map showing spectral accelerations with 2% probability of exceedance in 50 years. Urban seismic hazard maps useful for screening purposes and as check for site-specific studies; most site-specific studies do not consider basin effects or directivity effects Need to get basin amp terms into the building code for tall buildings Map from City of Seattle Unreinforced Masonry Building Seismic Hazards Study, 2007
Procedure to Make Urban Seismic Hazard Maps Used fault parameters and recurrence times from 2002 national seismic hazard maps PSHA= Probabilistic Seismic Hazard Assessment
Two scenarios for Seattle fault earthquakes M6.6 Ground-motion Maps (1 Hz) slip on fault surface Used kinematic description of rupture on fault surface