Download
1 / 21
220 likes | 376 Vues
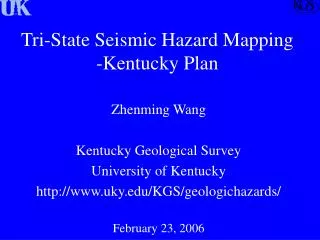
Tri-State Seismic Hazard Mapping -Kentucky Plan. Zhenming Wang Kentucky Geological Survey University of Kentucky http://www.uky.edu/KGS/geologichazards/ February 23, 2006. Outline. Seismic Hazards Primary Hazard – Ground Motion (on bedrock) Scenario ground motion

E N D
Tri-State Seismic Hazard Mapping-Kentucky Plan Zhenming Wang Kentucky Geological Survey University of Kentucky http://www.uky.edu/KGS/geologichazards/ February 23, 2006
Outline • Seismic Hazards • Primary Hazard – Ground Motion (on bedrock) • Scenario ground motion • USGS Hazard Maps (PSHA) • Secondary Hazard • Ground Motion Amplification (NEHRP Soil type) • Liquefaction • Induced slope instability • KGS Seismic Hazard Mapping – Kentucky Plan • Primary Hazard • Secondary Hazard
Seismic Hazard and Risk • Seismic hazard and risk are fundamentally different • Seismic Hazard • Natural phenomena generated by the earthquake, such as surface rupture, ground motion, ground-motion amplification, liquefaction, and induced-landslide that have potential to cause harm • Measurement: level of hazard and its recurrence interval • Seismic Risk (More Subjective) • likelihood (chance) of experiencing a level of seismic hazard for a given time exposure
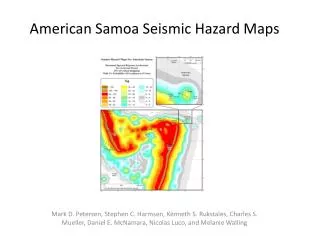
Seismic and Hurricane Hazards and Risk Only Seismic Hazards Are Considered by KGS
Ground Motion Secondary: Amplification (NEHRP soil) Liquefaction Slope failure Primary: USGS maps Policy considerations: IBC, IRC, and etc.
USGS Memphis Project (Cramer and others, 2006) De-amplification Amplification
Seismic Hazard Maps – KY Plan • Ground Motion Hazard Maps • Level of ground motion • How often it could occur • A set of scenario maps (ground motion vs. recurrence time) • Secondary Hazard Maps • Amplification map • Liquefaction potential map
Ground Motion Maps • Earthquake Sources • Faults • Occurrence frequency • Maximum magnitude • Ground Motion Attenuation • Methodology • PSHA • DSHA
Earthquake Sources 1. Where? 2. How Big? 3. How Often? Thousands years Historical Event: White County EQ? (~M7.5?, Mueller et al., 2004) Paleo-liquefactions (Obermeier et al.)
Ground Motion Attenuation M8.0 Conservative predictions (USGS WP, 2005) New attenuations (USGS WP, 2006)
Methodology • PSHA vs. DSHA • Same thing under certain conditions (Characteristic earthquake) • But different expressions PGA maps with 5% PE in 50 years (Cramer et al., 2006) = The maps may good for NMSZ (AASHTO ,KGS, and others) But good for the Tri-State Area?
Ground Motion Amplification • Directly • Vertical Strong Motion Stations • H/V spectral ratios (e.g. earthquakes and ambient noise) • Theoretical Modeling • Response based on amplification thru the Vs gradient of the soils/ sediments (e.g., SHAKE, etc.) • Empirical • NEHRP Soil Classification
Example 1 Example 2 Average Equation Vs=500 (ft/s) d=30 (ft) Vs=500 (ft/s) d=70 (ft) Vs=1000 (ft/s) d=40 (ft) Vs=1500 (ft/s) d=50 (ft) Vs=4000 (ft/s) (bedrock) Vs=4000 (ft/s) (bedrock) Vs=4000 (ft/s) (bedrock) 100/(70/500+30/4000)=678 (ft/s) => D (600 - 1200 ft/s) 100/(30/500+40/1000+30/1500)=833 (ft/s) => D (600 - 1200 ft/s) Notes: 1) based on CA geology: bedrock Vs~2,500 ft/s (B/C boundary) 2) in CUS, bedrock Vs >2,500 ft/s (A or B), applicable (?)
C C D (Street et al., 1997, Engineering Geology, 46:331-347)
Table 3. Estimated Susceptibility of Continental Deposits to Liquefaction (modified from Youd and Perkins, 1978). Step 1. Step 2. Further analysis based on: SPT, CPT, Vs values and INPUT MOTION
Summary • KGS will produce following maps for KY • Ground Motion Hazard Maps • A set of scenario maps (ground motion level vs. recurrence time) • Secondary Hazard Maps • Amplification maps (associated with the scenario maps) • Liquefaction potential maps (associated with the scenario maps) • All data will be available after completion of the maps