SEISMIC HAZARD
SEISMIC HAZARD. Presentation is based on: Allen, R., Earthquake hazard mitigation: New direction and opportunities, in "Treatise on Geophysics ” , 2007. Bilham, R., Earthquakes and urban growth, Nature 336, 625-626, 1988.

SEISMIC HAZARD
E N D
Presentation Transcript
SEISMIC HAZARD • Presentation is based on: • Allen, R., Earthquake hazard mitigation: New direction and opportunities, in "Treatise on Geophysics”, 2007. • Bilham, R., Earthquakes and urban growth, Nature 336, 625-626, 1988. • Bilham, R., Urban earthquakes fatalities: A safer world, or worse to come? Seis. Res. Lett. 75, 706-712, 2004.
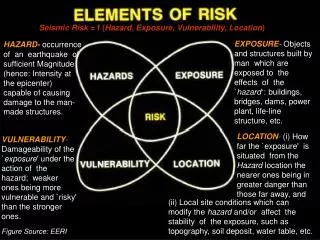
Seismic risk versus seismic hazard Seismic Hazardis the probability of occurrence of a specified level of ground shaking in a specified period of time. (But a more general definition includes anything associated with an earthquake that may affect the normal activities of people, i.e. surface faulting, ground shaking, landslides, liquefaction, tectonic deformation, and tsunamis.) Vulnerabilityis the degree of damage caused by various levels of loading. The vulnerability may be calculated in a probabilistic or deterministic way for a single structure or groups of structures. Seismic Riskis expressed in terms of economic costs, loss of lives or environmental damage per unit of time. It isthe job of the geophysiciststo provide hazard assessments (- but not risk assessments.)
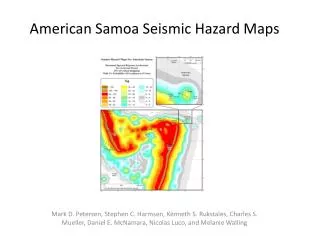
The US seismic hazard map PGA 2% in 50 years
The spatial distribution of earthquake activity is correlated with that of volcanic activity
Where do the largest earthquakes occur? It is known from both historical and modern data that the largest quakes strike in S. America, Alaska and throughout Asia. The three largest quakes in the past century are: Chile, 1969, Mw9.5 Alaska, 1964, Mw9.2 Sumatra-Andaman, 2004, Mw9.1 Japan, 2011, Mw9.0
Global seismic hazard (Figure from Allen, 2007) Map prepared by the Global Seismic Hazard Assessment Program (Giardini, 1999).
Consequences of urbanization Urbanization in developing nations is rapid, but is flat in industrial nations. (Figure from Bilham, 2004) ''By the year 2025 more than 5500 million people will live in cities - more than our entire 1990 combined rural and urban population.'' (from Roger Bilham’s web-page)
Consequences of urbanization Note the slower growth of cities in N. America and W. Euro. with respect to cities throughout Asia and S. America. Thus, the poor are at greater risk than the rich. The location of the largest cities in 1950 and 2000 superimposed on the hazard map.
Consequences of urbanization While cities in seismically safe regions are removed from the top 30 list, cities in hazardous regions grow more rapidly. Question: why are big cities built in areas of high seismic risk? (Figure from Allen, 2007)
Consequences of urbanization Sumatra (2004) Tangshan (1976) (Figure from Allen, 2007) 8000 per year Note that: 1. The change in character pre- and post- 1940. 2. The two largest quakes did not cause many fatalities. 3. The new millennium started really bad… 25,000 per year
Consequences of urbanization • While the number of fatalities is increasing, it is not increasing as global population. • Thus, an individual risk of dying has decreased by a factor of 2 since 1950. The chances of dying of an earthquake are very small. Only 1 out of 200,000 people per year! (Figure from Allen, 2007)
Fatalities rate vs. growth rate The conclusion that fatalities rate increase slower than population growth is not true for Iran (and some other developing nations). (Figure from Bilham, 2004) • Earthquake fatalities rate in Iran is in pace with the population growth. • Fatalities rate in Iran is rising at an increasing rate.
Does fatalities rate rises at an increasing rate? 500 years of historical and modern record suggest that the fatalities rate rises at an increasing rate (Bilham, 2004). (Figure from Bilham, 2004)
What to do? • Much of the risk may be mitigated by: • Implementation of Early Warning Systems. • Improvement and implementation of building codes. • Fault mapping.
Early Warning System (ERS) In many cases, the magnitude of an impending earthquake may be estimated a few tens of seconds prior to the arrival of the destructive ground motion to the populated area. In such cases, many lives may be saved simply by: • Automatic shutting down power supplies. • Automatic shutting down of nuclear reactors. • Automatic stopping or reducing the speed of fast trains. • Individual actions
Early Warning System (EWS) The October 17, 1989 M6.9 Loma Prieta, CA CISN California Integrated Seismic Network • Test system in CA is now operational • Alerts are delivered to a few dozens of scientists • About to start delivery to public and private partners Alert Shake
Early Warning System (EWS) The March 11, 2011 M9 Tohoku-oki, Japan JMA Since 2007 warning region 15 sec warning in Sendai -> success
Building codes • Earthquake don’t kill - buildings do (but also tsunami). • Earthquake resistant construction costs only 10% more than nonresistant construction. • Structures in CA built after 1976, when a new building code was implemented, suffered very little damage in the 1989 Loma Prieta and the 1994 Northridge. • The implementation gap.
Fault mapping • * Earthquakes occur on faults. • * Yet, the location of some major faults is unknown. • * Examples for major earthquakes that ruptured unrecognized faults include: • 1989, Loma Prieta. • 1994, Northridge.
But what about prediction? Short term vs. long term prediction The public wants this Scientists provide this Question: Will short term high probability prediction solve the problem?
But what about prediction? Lesson from the Hurricane Katrina example: It is possible to make high probability short term predictions for hurricanes, as was done in the case of hurricane Katrina. Still an estimated 1800 people were killed in New Orleans and neighboring areas. About 50% of New Orleans residences still have not yet returned to the city.
Public funding for earthquake science • Should the tax payer fund earthquake research? • Given that only 1 out of 200,000 people dies as a result of an earthquake. • Given that many (most?) scientists think the short term high probability prediction will not be possible.
The world has not yet experienced a major quake directly beneath a mega-city, the economic and geopolitical consequences of which are unimaginable. About 35% of Tangshan population perished in the 1976 quake. Such a fatalities rate in a city with a population of 3 million, would result in 1 million fatalities!!! • The two most damaging quakes in the U.S. were 1989, Loma Prieta, and the 1994, Northridge, cause “only” 60 deaths each, but cause financial loss of 10 and 46 billions dollars, respectively. • Advancement in EQ physics will pave the way to advancements in other fields, most notably material sciences and engineering.
Recommended readings: • Allen, R., Earthquake hazard mitigation: New direction and opportunities, in "Treatise on Geophysics”, 2007. • Bilham, R., Earthquakes and urban growth, Nature 336, 625-626, 1988. • Bilham, R., Urban earthquakes fatalities: A safer world, or worse to come? Seis. Res. Lett. 75, 706-712, 2004.