Download
1 / 11
110 likes | 224 Vues
This presentation by John Adams for the USGS Mmax meeting in Golden details Canada's 4th generation seismic hazard model, developed from 1994 to 1997 and finalized in 2003. The model, implemented in building codes in 2005, encompasses various seismic factors, including magnitude-recurrence data for significant historical earthquakes in Eastern Canada. Notable figures illustrate seismic hazard estimates, activity rates in stable cratons, and implications for large fault potential. For further information, visit the links provided for detailed documentation and analysis.

E N D
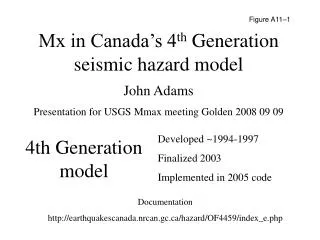
Figure A11–1 Mx in Canada’s 4th Generation seismic hazard model John Adams Presentation for USGS Mmax meeting Golden 2008 09 09 Developed ~1994-1997 Finalized 2003 Implemented in 2005 code 4th Generation model Documentation http://earthquakescanada.nrcan.gc.ca/hazard/OF4459/index_e.php
Figure A11–2 Magnitude-recurrence for eastern Canada 1929 Grand Banks 1933 Baffin Bay 7.5 8.0 7.3
One M6.5 per decade Figure A11–3 Stable Craton Core (SCC) rates and MmaxFenton and Adams, 1997; Fenton et al 2006 Places like Canadian Shield! http://earthquakescanada.nrcan.gc.ca/hazard/2006/2006FentonAdamsHalchukGEGE.pdf
Figure A11–4 B) Observed North American shield activity rate Wt = 0.4 Floor Hazard estimates - Three rates to capture uncertainty: A) Global earthquake activity of continental shields Wt =0.4 C) Rate for central Canada not in a source zone Wt = 0.2 Then, seismic hazard computed for centre of large zone
Figure A11–5 Uniform Hazard Spectrasoil class C Floor UHS for 2%/50yr
Figure A11–6 This is a 1999 deaggregation using EZ-Frisk. Details may have changed, but pattern will be the same.
Figure A11–7 Floor value
Figure A11–8 Mesozoic rifted margin Mobs ~7.4 Weighted branches best, upper, lower 7.5 8.0 7.3 0.68 0.16 0.16 Plenty of potential large faults -> M8
Figure A11–9 Paleozoic rifted margin Mobs ~7.0 Weighted branches best, upper, lower 7.5 7.7 7.2 0.68 0.16 0.16 Enough potential large faults
Interior ?slightly extended Mobs ~5.0 Weighted branches best, upper, lower 7.0 7.2 6.8 0.68 0.16 0.16 potential large faults? insensitive to Mmax consistent with SCC Figure A11–10
Paleozoic rifted margin Mobs ~5.0 Weighted branches best, upper, lower 7.5 7.7 6.0 0.68 0.16 0.16 potential large faults? insensitive to Mmax inconsistent with SCC! Figure A11–11