MODIS Sensor Characteristics & Hydra
MODIS Sensor Characteristics & Hydra. Steve Ackerman stevea@ssec.wisc.edu Cooperative Institute for Meteorological Satellite Studies University of Wisconsin-Madison. Slide Credits.

MODIS Sensor Characteristics & Hydra
E N D
Presentation Transcript
MODIS Sensor Characteristics &Hydra Steve Ackerman stevea@ssec.wisc.edu Cooperative Institute for Meteorological Satellite Studies University of Wisconsin-Madison
Slide Credits University of Wisconsin-Madison: Paul Menzel, Steve Ackerman, Paolo Antonelli, Chris Moeller, Kathy Strabala, Bryan Baum, Suzanne Seemann. MODIS Science Team: Michael King, Steve Platnick, Eric Vermote, Robert Wolfe, Bob Evans, Jacques Descloitres, Jack Xiong.
Introduction to Remote Sensing http://www.ssec.wisc.edu/sose/pirs/pirs_m2_footprint.html
Introduction to Satellite Orbits http://www.ssec.wisc.edu/sose/pirs/pirs_m1_leo.html
Terra Launched: Dec. 18, 1999 10:30 am descending ASTER: Hi-res imager CERES: Broadband scanner MISR: Multi-view imager MODIS: Multispectral imager MOPITT: Limb sounder
Launched: May 4, 2002 1:30 pm ascending AIRS: Infrared sounder AMSR-E: Microwave scanner AMSU: Microwave scanner CERES: Broadband scanner HSB: Microwave sounder MODIS: Multispectral imager Aqua
MODIS Challenges Multiple detectors: Detector differences are noticeable Dead or out-of-family detectors must be handled Multiple samples along track introduce bowtie distortion Spectral information: Many interdependent bands How to utilize all the spectral information? Data rate: Orders of magnitude larger than heritage sensors
Scan direction • Image Acquisition Details • Scan sequence: • Solar diffuser • Spectroradiometric Calibration Assembly • Blackbody • Space View • Earth scan Flight direction
MODIS Bowtie Artifacts Consecutive “bowtie” shaped scans are contiguous at nadir, and overlap as scan angle increases…
MODIS bowtie artifacts at edge of swath Band 2 (0.87 micron) 250 meter resolution
Bowtie Artifacts • Are not a ‘problem’: they are a consequence of the sensor design • Can be removed for visualization purposes by reprojecting the image onto a map • Do not affect science algorithms that run on a pixel-by-pixel basis or within one earth scan
Mirror Side Striping (Band 8, 0.41 m) Side 0 Side 1 Reflectance, emissivity, or polarization of each scan mirror side not characterized correctly. Can be corrected.
Noisy Detectors (Band 34, 13.6 m) Detectors are noisy on a per frame basis and unpredictable from scan to scan. Difficult to correct.
Saturation (Band 2, 0.87 m) Signal from earth scene is too large for 12 bit digitization with current gain settings. Workaround available.
MODIS Destriping • Striping is a consequence of the calibration algorithm, where each detector is calibrated independently. If the instrument were characterized perfectly, there would be no striping. • However, it is not possible to characterize the instrument perfectly because of time, cost, and schedule constraints. • As a result, striping artifacts are introduced by: • Two-side scan mirror is not characterized perfectly • Detectors behavior can change in orbit (bias, spectral response) • Detectors may be noisy • The challenge is to design a destriping algorithm which is effective, fast, and insensitive to instrument changes.
Getting MODIS data • Go to http://ladsweb.nascom.nasa.gov/data/ This is the data site. • Click on “Search” • Select the Satellite/Instrument, in this case “Aqua/Terra MODIS”.
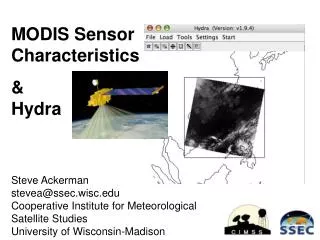
HYDRA http://www.ssec.wisc.edu/hydra/
HYDRA HYDRA - HYper-spectral data viewer for Development of Research Applications - provides a fast and flexible interface that allows users to explore and visualize relationships between passive observations of MODIS and AIRS with the active measurements of the CALIPSO lidar and CloudSat. HYDRA is a freeware based analysis toolkit for satellite data which has been developed to assist research and development of remote sensing applications as well as education and training of remote sensing scientists.
HYDRA enables interrogation of multispectral (and hyperspectral) fields of data so that • pixel location and spectral measurement values can be easily displayed; • spectral channels can be combined in linear functions and the resulting images displayed; • false color images can be constructed from multiple channel combinations; • scatter plots of spectral channel combinations can be viewed; • pixels in images can be found in scatter plots and vice versa; • transects of measurements can be displayed, and • soundings of temperature and moisture as well as spectra from selected pixels can be compared.
Step 2. Load data, local or on-line. You must load MODIS or AIRS data first.
Step 4. Start multi-channel view, MODIS or AIRS data opens Load data, local or on-line. You must load MODIS or AIRS data first.
Step 5. Under Tools, Select Linear Combinations from the pop up window
Summary • Hydra is an analysis and visualization tool to explore satellite data sets • Includes (MODIS, AIRS, CALIPSO, CloudSat, AMSU, GOES, AREA files)
For images: http://earthobservatory.nasa.gov For animations: http://svs.gsfc.nasa.gov For ordering data: http://echo.nasa.gov