Download
1 / 24
240 likes | 341 Vues
Illinois EPA uses RMMS to track and develop watershed plans. RMMS is an online mapping tool that assists in evaluating and managing Illinois’ natural resources, particularly water resources. It helps in identifying lakes, steams, NPDES outfalls, and more for effective resource protection. The tool generates reports on HUC12 watersheds, water quality, and soil characteristics. RMMS also tracks the implementation of watershed-based plans, BMPs, and Section 319-funded projects. Users can compare recommended BMPs with actual implementation to gauge progress.

E N D
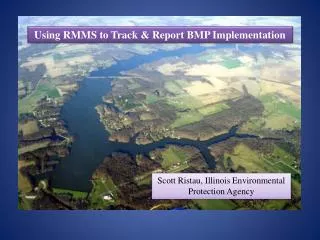
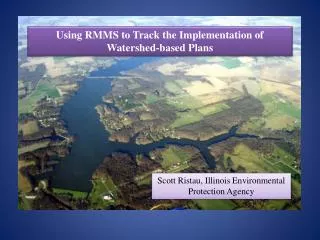
Using RMMS to Track the Implementation of Watershed-based Plans Scott Ristau, Illinois Environmental Protection Agency
Resource Management Mapping Service (RMMS) The Illinois Environmental Protection Agency (Illinois EPA) uses the Resource Management Mapping Service to help track the development and implementation of watershed-based plans in Illinois.
The Resource Management Mapping Service, or RMMS, is maintained by the University of Illinois with support from the Illinois EPA and other state agencies.The website is located at http://www.rmms.illinois.edu.
RMMS uses a wide range of coordinated natural resource related databases to provide an online, interactive mapping environment designed to help government agencies and others evaluate and manage geographically-based information about Illinois’ natural resources, particularly water resources, so that they can more effectively develop and implement appropriate resource protection and enhancement measures.
So there is a lot that RMMS can do but I’m going to focus primarily on those features that are used to track the implementation of watershed-based plans. However, I also want to point out that many of the data layers in RMMS can also help local stakeholders as they go through the process of developing a watershed-based plan.
Fore example, RMMS contains information on the physical location of lakes and streams assessed and reported in accordance with Section 305(b) of the Federal Clean Water Act.
The 305b assessment data for those lakes and streams can also be viewed in RMMS by using the map identify tool. The codes in the pop-up table are explained in the metadata, which can be viewed by clicking on the name of the data layer.
RMMS can also display the streams and lakes that have been listed in accordance with Section 303(d) of the Clean Water Act (CWA).
And we can look at the 303d list information using the map identify tool
RMMS can also generate HUC12 reports that are designed to describe important characteristics of an individual 12 digit hydrologic unit code (HUC) watershed. The Land Cover report describes the HUC 12 in terms of its size, floodzones, percent imperviousness, land use, governmental units, miles of stream, and lake acres.
The Water Quality report provides the 303d and 305b assessment information for those lakes and steams that are within that 12 digit HUC. It also provides information on the water quality monitoring stations, community water supply wells, and NPDES outfalls that fall within that 12 digit HUC.
The Soils report summarizes information about the soils within that 12 digit HUC in terms of hydrologic soil groups, hydric classification, drainage class, flooding frequency, runoff potential, runoff class, and highly erodible lands.
RMMS also contains data on watershed-based plans that have been developed to control nonpoint source (NPS) pollution. So we can see where we have plans and where we don’t.
Again, using the Map Identify tool you can see some basic information about an individual plan and there is also a link to a copy of the plan.
RMMS allows the user to run reports, such as a report to see what nonpoint source pollution control BMPs were recommended by a specific plan.
RMMS also contains information about BMPs that have actually been implemented, such data on individual BMPs implemented with Section 319 funding. Each pink star represents a Section 319 funded BMP.
The BMP information at RMMS is being used in a number of ways. For example, it’s used to: document NPS pollution control progress in terms of BMPs and pollutant load reductions at various scales (watershed, county, state); identify potential conflicts or synergies that may exist between proposed BMPs and past BMPs (i.e., will a proposed new streambank stabilization project adversely impact a wetland restoration project previously implemented in the same vicinity); facilitate follow up inspections of past BMPs to identify maintenance needs or other issues; identify future NPS control needs in relationship to past accomplishments; and track the implementation of watershed-based plans.
RMMS allows the user to run reports on BMP implementation, such as a report to list the BMPs implemented within the area covered by a watershed plan .
By having this information in RMMS users can compare the units (acres, feet, number) & load reductions of BMPs actually implemented under Section 319 and other programs to the BMP recommendations contained in the watershed plan to see what kind progress is being made in terms of implementing the plan.
For example, by combining the two RMMS tables we generated before we can see what was recommended versus what has been achieved in this planning area.
But we have to keep in mind that the BMP data layers currently available in RMMS don’t tell the whole story. For example, RMMS doesn’t have data on BMPs that are being implemented privately or under certain other government programs, such as those administered by NRCS.
The 319 BMP reports in RMMS also help us populate several fields in GRTS. For example, say we had a project that installed BMPs in multiple 12-digit HUCs. We can run a BMP report in RMMS for that specific project, download the report to Excel, and sort the results by HUC12.
This data can then be used to define the Drainage Areas in GRTS as well as the Pollutant Load Reduction fields and BMP fields in GRTS for those specific drainage areas.
Thank You Scott Ristau, Illinois Environmental Protection Agency Scott.Ristau@illinois.gov