Download
1 / 5
50 likes | 155 Vues
This study explores the functional redundancy among Arabidopsis Heat Shock Factor (HSF) genes using expression analysis and phenotype observation. The research focuses on HsfA2, HSP15.7CI, HsfB2a, HsfB2b, and HsfB4 genes, revealing insights into their roles in response to heat stress. Phylogenetic analysis of Arabidopsis HSF genes and comparative expression studies of class B Hsfs in different mutant lines shed light on their functional roles. The study also evaluates the morphological characteristics of hsfb1-1.hsfb2b-1 double-knockout plants. Through RT-PCR and phenotypic assessment, this investigation provides valuable information on the genetic redundancy and functional diversity of Arabidopsis HSF genes under non-heat conditions.

E N D
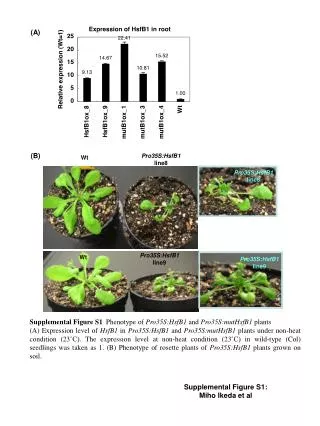
(A) Supplemental Figure S1:Miho Ikeda et al (B) Pro35S:HsfB1 line8 Wt Pro35S:HsfB1 line8 Pro35S:HsfB1 line9 Wt Pro35S:HsfB1 line9 Supplemental Figure S1 Phenotype of Pro35S:HsfB1 and Pro35S:mutHsfB1 plants (A) Expression level of HsfB1 in Pro35S:HsfB1 and Pro35S:mutHsfB1 plants under non-heat condition (23˚C). The expression level at non-heat condition (23˚C) in wild-type (Col) seedlings was taken as 1. (B) Phenotype of rosette plants of Pro35S:HsfB1 plants grown on soil.
(A) Introduction of DNA by bombardment LUC assay 23˚C 7 h 23˚C 6 h +37˚C 1 h 23˚C 5 h +37˚C 1 h+23˚C 1 h (B) * 23˚C 7 h * * 23˚C 6 h + 37˚C 1 h Supplemental Figure S2:Miho Ikeda et al * 23˚C 5 h + 37˚C 1 h + 23˚C 1 h Supplemental Figure S2 Conditions of heat treatment and transient expression assays. (A) The conditions of heat treatments. The grey shading indicates incubation at 37˚C. (B) Relative luciferase (LUC) activities after cobombardment of Arabidopsis leaves with the Pro35S:HsfB1 (black bars; HsfB1) and Pro35S:mutHsfB1 (open bars; mutB1) effectors and ProHsfA2:LUC reporter genes. The relative activity due to the pBIG vector at 23˚C for 7 h (cont; gray bars) was taken as 1. Error bars indicate the SD (n = 3). Asterisks indicate P-values below 0.05 between control and others.
AtHsfA1b AtHsfA2 AtHsfA1e At-HsfA7b AtHsfA1d At-HsfA7a At-HsfA6b AtHsf1 100 At-HsfA6a At-HsfB2aR 99 64 68 34 51 91 At-HsfA9 100 87 64 46 96 42 At-HsfB2bR 100 43 100 33 At-HsfA8 100 At-HsfB1R At-HsfA5 At-HsfB4R At-HsfA4a At-HsfB3R At-HsfA4c At-HsfC1 0.1 At-HsfA3 (A) hsfb1-2 (roots of 27-day-old plants) Relative expression (B) Supplemental Figure S3:Miho Ikeda et al (C) Supplemental Figure S3 Analysesd of functional redundancy among class B Hsfs. (A) The relative expression levels of HsfA2, HSP15.7CI, HsfB2a, HsfB2b and HsfB4 genes, as determined by RT-PCR in roots of 27-day-old plants of the hsfb1-2 tag line (SALK_012292; Supplemental Figure S4) and wild-type plants (white and black columns; n = 15) under non-heat condition (23˚C). The expression level at non-heat condition (23˚C) in wild-type (Col) seedlings was taken as 1. (B) Phylogenetic tree of Hsf genes from Arabidopsis. The red superscript R indicate genes with a BRD. The numbers next to the branches indicate percentage of replicate trees in which the associated taxa clustered together in the bootstrap analysis (1000 replicates). (C) The relative expression levels of three class B Hsfs treated with 34˚C in seedlings grown on agar plate.
hsfb1-2 hsfb2b-2 hsfb1-1 hsfb2b-1 (A) SALK_104713 (b1-1) SALK_047291 (b2b-1) HsfB1 HsfB2B RD RD SALK_012292 (b1-2) SALK_045982 (b2b-2) (B) Wt1 Wt2 b1-2 b2b-2 b1-1 b2b-1 Supplemental Figure S4:Miho Ikeda et al (C) Supplemental Figure S4 Analysis of T-DNA tagged lines for hsfB1 and hsfB2b (A) Schematic diagram of the structures of the HsfB1 and HsfB2b genes and the sites of insertion of T-DNA (in SALK_104713, SALK_012292, SALK_047291 and SALK_045982) in the corresponding genes. Filled boxes and arrows represent coding regions. Lines represent non-coding regions. Grey arrows indicate the PCR primer for the RT-PCR analysis. (B) Expression levels of HsfB1 (black bars) and HsfB2b (white bars), as determined by RT-PCR, in 7-day-old of hsfb1-1 hsfb2b-1, hsfb1-2 hsfb2b-2 and two lots of wild-type seedling grown on agar plate under non-heat conditions (23˚C). The expression level of the ubiquitin gene was used for normalization of the results. The level in wild-type lot1 (Wt1; Col) seedlings was taken as 1. Error bars indicate the SD (n = 3). (C) Expression levels of HsfA2, HsfA7a, HSP15.7CI and HsfA3, as determined by RT-PCR, in 7-day-old hsfb1-2 hsfb2b-2 (yellow bars), hsfb1-1 hsfb2b-1 (red bars) and two lots of wild-type (white and grey) seedlings grown on agar plate under non-heat conditions (23˚C). The expression level of the ubiquitin gene was used for normalization of the results. The level in wild-type lot1 (Wt1; Col) seedlings was taken as 1. Error bars indicate the SD (n = 3).
(A) (B) Supplemental Figure S5:Miho Ikeda et al 5 cm Wt hsfb1-1 hsfb2b-1 Supplemental Figure S5 Morphologicalanalysis of hsfb1-1 hsfb2b-1 double-knockout plants. (A) Lengths of hypocotyls and roots of two independent wild-type (Wt 1 and Wt 2) and hsfb1-1 hsfb2b-1 seedlings grown on agar plates for 6 days under 23˚C. (B) Wild-type and hsfb1-1 hsfb2b-1 rosette plantsgrown on soil under 23˚C.