Download
1 / 39
390 likes | 415 Vues
This empirical-based analysis examines the performance of a cooperative location-sensing system using a grid-based representation and probabilistic framework. It explores the classification of the system, voting algorithms, and position estimation techniques.

E N D
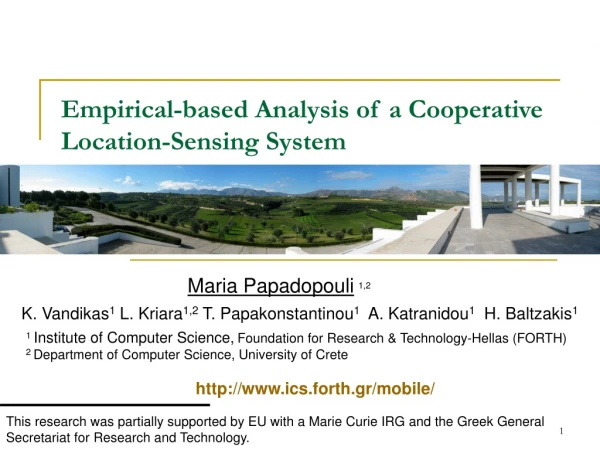
Empirical-based Analysis of a Cooperative Location-Sensing System Maria Papadopouli1,2 1Institute of Computer Science,Foundation for Research & Technology-Hellas (FORTH) 2 Department of Computer Science, University of Crete http://www.ics.forth.gr/mobile/ This research was partially supported by EU with a Marie Curie IRG and the Greek General Secretariat for Research and Technology.
Overview • Motivation • Taxonomy of location-sensing systems • Collaborative Location Sensing (CLS) • Performance analysis • Conclusions • Future work
Motivation • Emergence of location-based services in several areas • transportation & entertainment industries • emergency situations • assistive technology → Location-sensing is critical for the support of location-based services
Taxonomy of location-sensing systems • Modalities • Dependence on & use of specialized infrastructure & hardware • Position and coordinationsystem description • Cost, accuracy& precision requirements • Localized or remote computations • Device identification, classificationor recognition • Models& algorithms for estimating distances, orientation & position • Radio (Radar, Ubisense, Ekahau), • Infrared (Active Badge) • Ultrasonic (Cricket) • Bluetooth • Vision (EasyLiving) • Physical contact with pressure (smart floor) or touch sensors
Cooperative Location-Sensing (CLS) • Enablesa device to determine its locationinself-organizing manner using the peer-to-peer paradigm • Employs a grid-based representation of the physical space → can incorporate contextual information to improve its estimates • Uses a probabilistic-based framework • Each cell of the grid has a value that indicates likelihood that the local device is in that cell • These values are computed iteratively using distance between peers and position predictions
Classifying CLS • Modalities • Dependence on & use of specialized infrastructure & hardware • Position and coordinationsystem description • Cost, accuracy& precision requirements • Localized or remote computations • Device identification, classificationor recognition • Models& algorithms for estimating distances, orientation & position • Radio and/or Bluetooth • Can be extended to incorporate other type of modalities • No need for specialized hardware or infrastructure • Can use only IEEE802.11 APs, if necessary Grid representation of the space Transformation to/from any coordination system Position: a cell in the grid Objective: 0.5 to 2.5 m (90%) • Computations can be performed remotely or at the device depending on the device capabilities • Does not perform any of these functionalities • Statistical analysis and particle filters on signal strength measurements collected from packets exchanged with other peers
Example of voting process (1/2) • Accumulation of voteson grid cells of host at different time steps
Example of voting process (2/2) Peers A, B, C have positioned themselves Most likely position Host A x x x Host C votes Host B votes
Voting algorithm • Initialize the values of the cells in the grid of the local device • Gather position information from peers • Recordmeasurements from these received messages • Transform this information to probabilityof being at a certain cell of its local grid • Add this probabilityto the existing value that this cell had from previous steps • Assess if the maximal value of the cells in the gridis sufficient high to indicate the position of the device
Signal-strength measurements per AP AP1 AP2 cell Training-phase signature weight of that cell Run-time signature Example of training & run-time signature comparison comparison
Position estimation (at peer A) Landmarks vote • Initialize the values of the cells in the grid of the local device • Training phase: Build a signal-strength map of the space (training-phase signatures) • Run-time phase: Build signal-strength signature of the current position • Compare the run-time and training phase signatures • For each new peer that sends its position estimation (e.g., peer B) • PositionB on the local grid of A based on B’s estimation • Determine their distance based on signal-strength signature • Infer likely positions of A • Update the value of the cells accordingly • Assess maximal weight of the cells, accept or reject the solution Non-landmark peers vote
training confidence interval of i-th AP total number of APs run-time confidence interval of i-th AP Signature based on confidence interval of signal-strength values Weight of cell c assigned as:
Signal-strength measurements per AP + + - - T1 T1 AP1 T1 T1 + + - - T2 T2 T2 AP2 cell Training-phase signature weight of that cell Run-time signature Example of confidence interval-based comparison [ T-, T+ ] confidence interval based on signal strength measurements from an AP T2 … - R 1+ + - … R R2 R2 1
ith distance from training set entries oftraining set confidence interval of the run-time measurements confidenceinterval of the i-th entry in the training set Distance estimation between two peers
number of percentiles jth percentile ofith cell in trainingset samples in training set jth run-time percentile Signature based on percentiles of the signal-strength values
Particle filter-based framework step 1 forL = 1, … , P (L-th particle) Transition: Draw new samplexk(L) , P( xk(L) | xk-1(L) ) Compute weightwk(L) of xk(L), wk(L) = wk-1(L)* P( yk| xk(L) ), where ykmeasurement vector: signal strength values end loop Normalize weights Resample Goto step 1
Performance evaluation • Performance analysis of CLS via simulations [percom’04] • Empirical-based measurements in different areas • Various criteria for comparing the training phase and run-time signatures • Particle-filter model • Impact of the number of signal strength measurements • Impact of the number of APs and peers • CLS vs. Ekahau
Testbed description • Area7m x 12m @ Telecommunication and Networks Lab (in FORTH) • Each cell of50cm x 50cm • Total 11 IEEE802.11 APs in the area • 3.5 APs,on average @ any cell
Similarities between CLS & Ekahau v3.1 • Use IEEE802.11infrastructure • Create map with callibration data • Compare trainning & run-timemeasurements
Ekahau vs. CLS no peers only APs participate additional measurements Percentiles capture more information about the distribution of signal strength
Impact of number of APs One AP off
Impact of peers One extra peer
Conclusions • The density of landmarks and peers has a dominant impact on positioning • Experiments were repeated at the lab in FORTH and in a conference room @ ACM Mobicom • median location error 1.8 m • Incorporation of Bluetooth measurements to improve performance • median location error 1.4 m
Discussion & future work (1/2) • Reduce training, management & calibration overhead • Easily detect changes of the environment • density and movement of users or objects • new/rogue APs • Inaccurate information & measurements • Singular spectrum analysis of signal strength • Distinguish the deterministic and noisy components • Construct training and run-time signatures based on the deterministic part
Discussion & future work (2/2) • Incorporateheuristics • about hotspot areas, user presence and mobilityinformation, and topological information of the area (e.g., existence of walls) • Experiment with other wireless technologies • Sensors, cameras, and RF tags I
UNC/FORTH Archive Online repository of models, tools, and traces • Packet header, SNMP, SYSLOG, signal quality http://netserver.ics.forth.gr/datatraces/ Free login/ password to access it Joint effort of Mobile Computing Groups @FORTH & UNC maria@csd.uoc.gr Thank You! Any questions?
Multimedia Travel Journal Tool • Novel p2p location-based application for visitors • Allow multimedia file sharing among mobile users
Simulations • Simulation setting (ns-2) • 10 landmarks • 90 stationary nodes • avg connectivity degree = 10 • transmission range (R) = 20m • For low connectivity degree or few landmarks • the location error is bad • For 10% or more landmarks and connectivity degree of at least 7 • the location error is reduced considerably
Joint IEEE802.11 & Bluetooth estimation experimentsimpact of modalities - performance analysis