Download
1 / 18
230 likes | 539 Vues
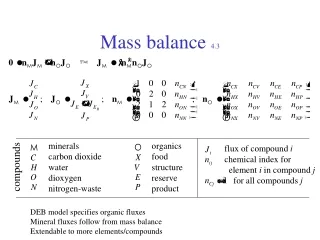
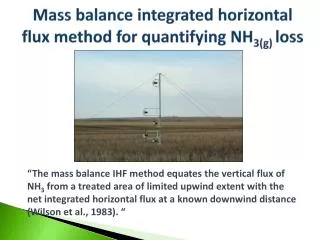
Mass balance integrated horizontal flux method for quantifying NH 3(g) loss. “The mass balance IHF method equates the vertical flux of NH 3 from a treated area of limited upwind extent with the net integrated horizontal flux at a known downwind distance (Wilson et al., 1983). “.

E N D
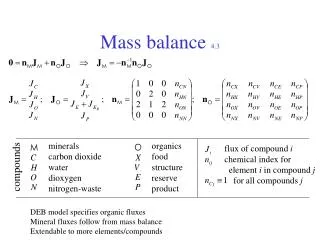
Mass balance integrated horizontal flux method for quantifying NH3(g) loss “The mass balance IHF method equates the vertical flux of NH3 from a treated area of limited upwind extent with the net integrated horizontal flux at a known downwind distance (Wilson et al., 1983). “
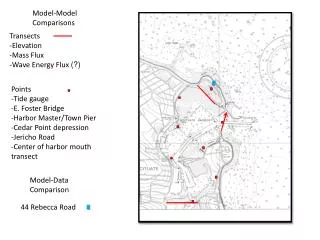
Hypothetical field situation wind -unfertilized area + urea x x masts with ammonia traps & anemometers “Try to imagine we have applied urea to a small area (green shaded) inside a larger unfertilized field. Assume the wind is blowing from right to left”.
downwind upwind wind direction Zp, height of gas profile development diffusion & turbulence convection NH3(g) NH3(g) NH3(g) anemometer urea prills NH(3) traps “The following diagram is modified from Ryden et al. (1984) and illustrates ammonia production from the soil surface (treated with urea). Ammonia moves upward as a result of diffusion and turbulence, and moves laterally due to convection. Masts with NH3 traps and anemometers to measure wind speed are placed at upwind and downwind boundaries” x x
downwind upwind Zp Height, m Height, m Height, m c1 Wind speed, m sec-1 c1 c1 NH3 conc., µg N m-3 NH3 conc., µg N m-3 “These figures illustrate typically profiles of ammonia concentration in the air at downwind and upwind positions, and wind speed. Source: Ryden et al.,1984”.
Horizontal NH3(g)flux calculation i=5 i=4 i=3 i=2 u = wind speed, m/sec i=1 c = concentration, μg/m3 ”Horizontal flux, or the product of wind speed x concentration, is calculated for each of the five planes (i)”
Vertical NH3(g) flux calculation (Fv) x x Height x x fetch distance, m x Horizontal flux “To calculate Fv a plot of height vs. horizontal flux is made at each of the five planes. The horizontal flux is then integrated over the height intervals and divided by the fetch distance”.
Fetch distance wind direction downwind upwind “Fetch is the distance between downwind and upwind boundaries”. NH3(g) NH3(g) NH3(g) urea prills x x
Vertical NH3(g)flux correction for backgroundemissions downwind mast “To compute the net vertical flux, ammonia flux at the upwind mast position is subtracted from the downwind mast position”. upwind mast x x x x Height Height x x x x x x Horizontal flux Horizontal flux
Net vertical NH3(g) calculation Height Horizontal flux
Passive samplers or shuttles developed in Australia by Leuning et. al (1985) eliminates the need for wind speed measurements with anemometers horizontal flux (NH3 concentration x wind speed) is calculated from the equation! M = mass of ammonia (µg) collected T = time A = effective cross-section sampling area the shuttle
‘Effective sampling area’ was defined in wind tunnel tests with shuttles 25 20 Slope = 2.42 x 10⁻⁵ m2 15 Flow rate (10-5 m3 s-1) A = effective sampling area 10 5 0 0 2 4 6 8 10 Source: Leuning et al. (1985) Atmospheric Environ. Wind speed (m s-1)
Shuttle design is critical and needs to.… ..mimic the design of Leuning et al. (1985).
Mast and shuttles 2.75 m 1.50 m 1.00 m Shuttles rotate on a pivot and point into wind 0.50 m 0.25 m “Five shuttles are placed on all masts in a gradient spacing with the top shuttle being situated at the approximate Zp height”.
Circular plots (40 m dia.) IHF method requires • known fetch distance (radius = 20 m) • large unfertilized buffer areas necessary around plots urea + Agrotain background 200 m + urea (90 lbs N/a)
Continuous measurements shuttles on mast exchanged weekly with recharged shuttles
Ammonia loss calculation ammonia trapped in shuttles is eluted in the lab and elutants run on a Timberline ammonia analyzer calculations of ammonia are done in Excel spreadsheets (μg N m-2 sec-1) x time period losses expressed as a fraction of urea-N applied 5 4 Height 3 2 1 M/AT
Summary – hopefully more clear “The mass balance IHF method equates the vertical flux of NH3 from a treated area of limited upwind extent with the net integrated horizontal flux at a known downwind distance (Wilson et al., 1983). “ Key points • minimal disturbance to site and provides time-integrated measurement; widely recognized