
Exploring California's Ozone Pollution: A Comprehensive Case Study
E N D
Presentation Transcript
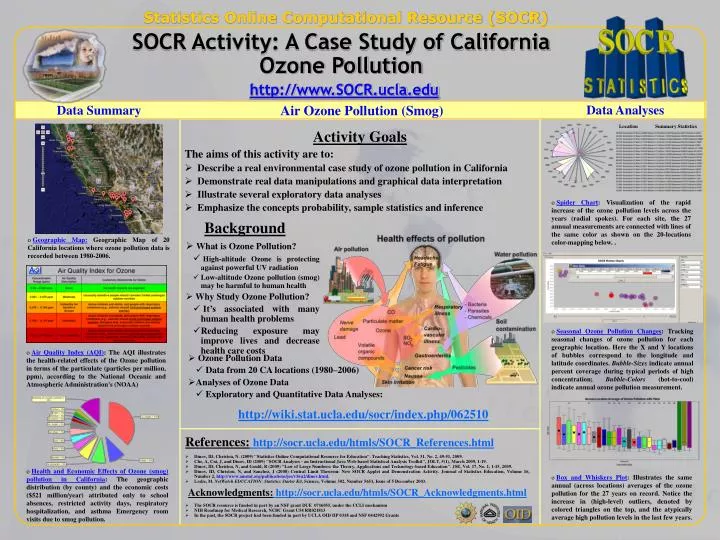
Statistics Online Computational Resource (SOCR) SOCR Activity: A Case Study of California Ozone Pollution http://www.SOCR.ucla.edu Data Summary Air Ozone Pollution (Smog) Data Analyses Location Summary Statistics Activity Goals • The aims of this activity are to: • Describe a real environmental case study of ozone pollution in California • Demonstrate real data manipulations and graphical data interpretation • Illustrate several exploratory data analyses • Emphasize the concepts probability, sample statistics and inference References:http://socr.ucla.edu/htmls/SOCR_References.html • Dinov, ID, Christou, N. (2009) "Statistics Online Computational Resource for Education". Teaching Statistics, Vol. 31, No. 2, 49-51, 2009. • Che, A, Cui, J, and Dinov, ID (2009) "SOCR Analyses – an Instructional Java Web-based Statistical Analysis Toolkit", JOLT, 5(1), March 2009, 1-19. • Dinov, ID, Christou, N, and Gould, R (2009) "Law of Large Numbers: the Theory, Applications and Technology-based Education". JSE, Vol. 17, No. 1, 1-15, 2009. • Dinov, ID, Christou, N, and Sanchez, J (2008) Central Limit Theorem: New SOCR Applet and Demonstration Activity. Journal of Statistics Education, Volume 16, Number 2, http://www.amstat.org/publications/jse/v16n2/dinov.html. • Leslie, M. NetWatch EDUCATION: Statistics Starter Kit, Science, Volume 302, Number 5651, Issue of 5 December 2003. Acknowledgments:http://socr.ucla.edu/htmls/SOCR_Acknowledgments.html • The SOCR resource is funded in part by an NSF grant DUE 0716055, under the CCLI mechanism • NIH Roadmap for Medical Research, NCBC Grant U54 RR021813 • In the past, the SOCR project had been funded in part by UCLA OID IIP 0318 and NSF 0442992 Grants • Spider Chart: Visualization of the rapid increase of the ozone pollution levels across the years (radial spokes). For each site, the 27 annual measurements are connected with lines of the same color as shown on the 20-locations color-mapping below. . Background • Geographic Map: Geographic Map of 20 California locations where ozone pollution data is recorded between 1980-2006. • What is Ozone Pollution? • High-altitude Ozone is protecting against powerful UV radiation • Low-altitude Ozone pollution (smog) may be harmful to human health • Why Study Ozone Pollution? • It’s associated with many human health problems • Reducing exposure may improve lives and decrease health care costs • Seasonal Ozone Pollution Changes: Tracking seasonal changes of ozone pollution for each geographic location. Here the X and Y locations of bubbles correspond to the longitude and latitude coordinates. Bubble-Sizes indicate annual percent coverage during typical periods of high concentration; Bubble-Colors (hot-to-cool) indicate annual ozone pollution measurement. • Air Quality Index (AQI): The AQI illustrates the health-related effects of the Ozone pollution in terms of the particulate (particles per million, ppm), according to the National Oceanic and Atmospheric Administration's (NOAA) • Ozone Pollution Data • Data from 20 CA locations (1980–2006) • Analyses of Ozone Data • Exploratory and Quantitative Data Analyses: • http://wiki.stat.ucla.edu/socr/index.php/062510 • Health and Economic Effects of Ozone (smog) pollution in California: The geographic distribution (by county) and the economic costs ($521 million/year) attributed only to school absences, restricted activity days, respiratory hospitalization, and asthma Emergency room visits due to smog pollution. • Box and Whiskers Plot: Illustrates the same annual (across locations) averages of the ozone pollution for the 27 years on record. Notice the increase in (high-level) outliers, denoted by colored triangles on the top, and the atypically average high pollution levels in the last few years.