Data Summary
This summary outlines the findings and implications from the LibQUAL+™ survey conducted in 2005, involving 247 institutions, including UVSC faculty, staff, and students. It emphasizes the importance of addressing user perceptions to improve satisfaction and library services. The survey results highlight key areas for enhancement, such as service quality and library environment. The report advocates for ongoing user input, effective service promotion, and comparative analysis with other institutions to guide future improvements and align library offerings with user needs.

Data Summary
E N D
Presentation Transcript
Data Summary July 27, 2005
Dealing with Perceptions! • Used to quantifiable quality (collection size, # of journals, etc.) • Survey of opinions or perceptions • Don’t take it personally • Cannot argue with perceptions • Can only attempt to design methods and services to address the perception and increase user satisfaction
LibQUAL+™ Goals • To begin a process of comparison • To measure and demonstrate impact • To choose where to focus further improvements • Commitment to user input and an awareness of the role of users in guiding library initiatives
General Facts • Created by ARL and Texas A&M University • 247 institutions participated in 2005 • Included all UVSC faculty, staff and students • Distributed via direct email, newsletters, Communicator, Academic Communicator, Student News and in print
Response Summary • 442 complete surveys • Incomplete surveys were not kept • Surveys with more than 11 “n/a” responses deleted • Surveys containing more than 9 logical inconsistencies deleted (Minimum should not be higher than Desired rating)
Demographic Summary • Percentage of Respondents by User Group
Demographic Summary • Number of Respondents by Discipline
Demographic Summary • Percentage of Respondents by Age
“22 Questions and a Box” • 22 core statements covering many areas of library service • “When it comes to…” • Minimum, Desired, Perceived Level of Service • Responses 1-9 with 9 most favorable • Service Adequacy Gap • 5 local statements • 1 box for comments • 172 out of 442 surveyed provided comments
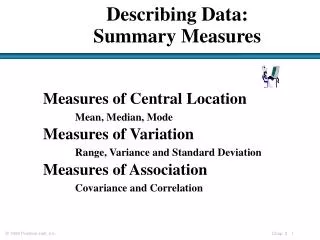
Survey Summary • Core statements summarized into three areas (dimensions): • Affect of Service – how the patron is treated • Library as Place – the library facility and environment • Information Control – personal control of and access to information
Service Adequacy (Difference between Perceived Service mean and Minimum Service Mean) • Most Positive Adequacy Means • AS-1: Employees who instill confidence in others (.69) • AS-2: Giving users individual attention (.68) • Negative Adequacy Means • LP-1: Library space that inspires study and learning (-.07) • LP-2: Quiet space for individual activities (-.04)
How often do you use resources on the library premises? • Percentage of Students and Faculty
How often do you access library resources through a library Web page? • Percentage of Students and Faculty
How often do you use Yahoo ™, Google ™, or non-library gateways for information? • Percentage of Students and Faculty
Local Questions Summary • Adequacy Mean
Survey Comments • Alert us to problems or possibilities: • “I’m sure your facilities are able to do so much more than I ever try to access. Sometimes I don’t know where to start ---just like a student. Do you offer research classes? That would be great. Since getting my doctorate, I have forgotten how to use the library as an instructional tool.” • Faculty member, age 46-65 • How-to Tuesdays: “Research for Dummies”
Comments: Positive Perceptions • Great job with the limited resources • Appreciate specific services: ILL, electronic reserve, textbooks • “library has been one of the best things about my experiences at this school” • “happy atmosphere” • “library is the best place on campus” • Staff service
Comments: Negative Perceptions • Noise • Study space • Confusing to find research • Number and currency of resources • Uncomfortable chairs • Slow computers on 4th floor • Number of online resources • Staff service
Some examples of things we can take action on: • Too much cell phone noise • More library staff taking notice of people who are disturbing others • One circulation person to handle everything for course reserves and faculty requests • Revised and improved web interface • Maybe a few Apple computers • No vacuuming during business hours • Some headphones are broken • Put notices in the study rooms of the hours and what time the library and desks close
“We asked them what they thought, now what do we do?” • Commitment to change • Dealing with perceptions: • Promote services and resources you already offer but which users seem not to use or be aware of • Place a greater emphasis on on-going customer service training for library staff • Attempt to address significant collection and access issues with new services
Future Possibilities and Plans • Focus groups to explore problems/solutions • Ex…Library Hours • Compare results with comparable institutions • Carry out every 3 years (2008) • Track and compare data • Use findings for strategic planning