Download
1 / 3
30 likes | 162 Vues
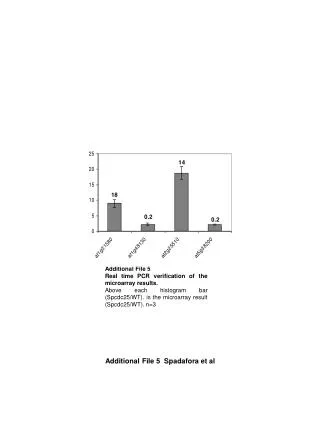
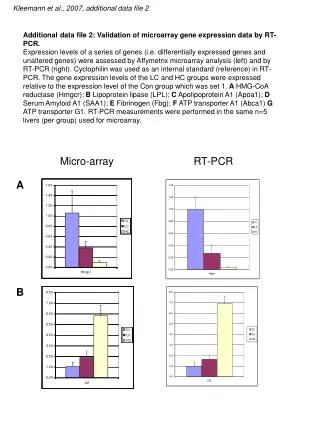
This study validates microarray gene expression data using RT-PCR to assess the expression levels of several genes in different experimental groups. The analysis focuses on differentially expressed and unaltered genes, with key genes such as HMG-CoA reductase and lipoprotein lipase being evaluated. Cyclophilin serves as an internal standard for RT-PCR, and gene expression levels are compared relative to the control group. The data is based on five liver samples from each group used in the microarray analysis.

E N D
Kleemann et al., 2007, additional data file 2 Additional data file 2:Validation of microarray gene expression data by RT-PCR. Expression levels of a series of genes (i.e. differentially expressed genes and unaltered genes) were assessed by Affymetrix microarray analysis (left) and by RT-PCR (right). Cyclophilin was used as an internal standard (reference) in RT-PCR. The gene expression levels of the LC and HC groups were expressed relative to the expression level of the Con group which was set 1. A HMG-CoA reductase (Hmgcr); B Lipoprotein lipase (LPL); C Apolipoprotein A1 (Apoa1); D Serum Amyloid A1 (SAA1); E Fibrinogen (Fbg); F ATP transporter A1 (Abca1) G ATP transporter G1. RT-PCR measurements were performed in the same n=5 livers (per group) used for microarray. Micro-array RT-PCR A B
Kleemann et al., 2007 Micro-array RT-PCR C D E
Kleemann et al., 2007 F Micro-array RT-PCR G