Effects of INPP4B on Protease Levels and Activity in PC-3 Tet-On Cells Treated with Doxycycline
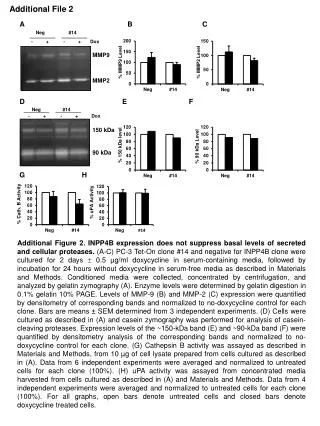
This study investigates the role of INPP4B in regulating the basal levels of secreted and cellular proteases, specifically MMP-2 and MMP-9, in PC-3 Tet-On clone cells. Cells were cultured with and without doxycycline, and conditioned media were analyzed via gelatin zymography and densitometry. The activity of cathepsin B and uPA was also assessed. Results reveal that INPP4B expression does not suppress protease levels, with implications for understanding proteolytic processes in prostate cancer. Data are based on three to six independent experiments, normalized to control.

Effects of INPP4B on Protease Levels and Activity in PC-3 Tet-On Cells Treated with Doxycycline
E N D
Presentation Transcript
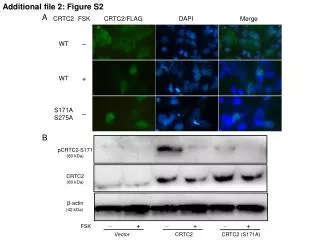
Additional File 2 A B C Neg #14 - + - + Dox MMP9 % MMP9 Level % MMP2 Level MMP2 D E F Neg #14 - + - + Dox 150 kDa % 150 kDa level % 90 kDa Level 90 kDa G H % uPA Activity % Cath. B Activity #14 Additional Figure 2. INPP4B expression does not suppress basal levels of secreted and cellular proteases.(A-C) PC-3 Tet-On clone #14 and negative for INPP4B clone were cultured for 2 days 0.5 µg/ml doxycycline in serum-containing media, followed by incubation for 24 hours without doxycycline in serum-free media as described in Materials and Methods. Conditioned media were collected, concentrated by centrifugation, and analyzed by gelatin zymography (A). Enzyme levels were determined by gelatin digestion in 0.1% gelatin 10% PAGE. Levels of MMP-9 (B) and MMP-2 (C) expression were quantified by densitometry of corresponding bands and normalized to no-doxycycline control for each clone. Bars are means ± SEM determined from 3 independent experiments. (D) Cells were cultured as described in (A) and casein zymography was performed for analysis of casein-cleaving proteases. Expression levels of the ~150-kDa band (E) and ~90-kDa band (F) were quantified by densitometry analysis of the corresponding bands and normalized to no-doxycycline control for each clone. (G) Cathepsin B activity was assayed as described in Materials and Methods, from 10 µg of cell lysate prepared from cells cultured as described in (A). Data from 6 independent experiments were averaged and normalized to untreated cells for each clone (100%). (H) uPA activity was assayed from concentrated media harvested from cells cultured as described in (A) and Materials and Methods. Data from 4 independent experiments were averaged and normalized to untreated cells for each clone (100%). For all graphs, open bars denote untreated cells and closed bars denote doxycycline treated cells.