Additional file 2
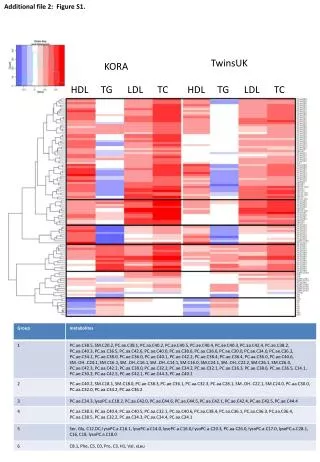
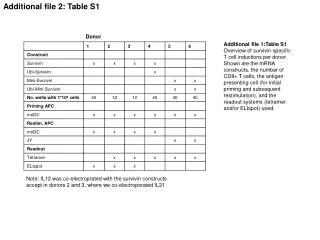
Additional file 2. depleted. enriched. 1. 0.01. 10 -4. 10 -6. 0. 0.9. pValues. Table S1. Chalmel et al. 2007. Mitotic. Meiotic. G9 vs G22. 171 / 65. 11 / 16. S9 vs S22. 93 / 39. 2 / 9. S9 sel. 21 / 9. 0 / 2. G9 sel. 25 / 13. 1 / 3. G9 vs S9. 52 / 29. 5 / 7. S9 vs G9.


Additional file 2
E N D
Presentation Transcript
depleted enriched 1 0.01 10-4 10-6 0 0.9 pValues Table S1 Chalmel et al. 2007 Mitotic Meiotic G9 vs G22 171 / 65 11 / 16 S9 vs S22 93 / 39 2 / 9 S9 sel 21 / 9 0 / 2 G9 sel 25 / 13 1 / 3 G9 vs S9 52 / 29 5 / 7 S9 vs G9 62 / 38 8 / 9 S22 vs G22 125 / 73 53 / 17 G22 vs S22 50 / 60 10 / 14 G22 vs G9 20 / 22 32 / 5 G22 sel 36 / 49 58 / 11 S22 sel 16 / 35 9 / 8 S22 vs S9 39 / 84 36 / 19
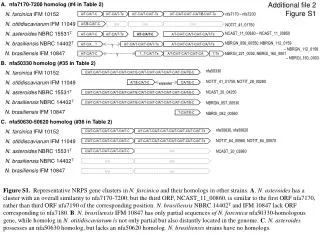
Table S2 : List of the most up-regulated genes in rat spermatogonia cells at 9dpp. The 445 probe sets in the 2-fold selective G9 cluster (shown in figure 2), were classified in 14 molecular and cellular functional groups based on their GO (gene Ontology) annotation. Shown are 93 genes represented in 183 probes detecting a minimally 4-fold variation in pair wise comparison. 9vs22 : mean fold change between Spga at 9dpp (G9) vs 22 dpp (G22). GvsS :mean fold change between Spga at 9dpp (G9) vs Sertoli at 9dpp (S9) (* predicted genes). Signal transduction 9vs22 GvsS Dusp1 dual specificity phosphatase 1 10.06 3.86 Sdpr serum deprivation response protein 9.90 5.83 Rnd3 Rho family GTPase 3 9.11 3.48 Ppp1r14c protein phosphatase 1, regulatory (inhibitor) subunit 14c 7.74 3.53 Trib2* similar to Tribbles homolog 2 6.59 2.59 Tm4sf12 transmembrane 4 superfamily member 12 (predicted) 5.59 3.46 Sgk serum/glucocorticoid regulated kinase 5.22 5.22 Arhgap21* Rho GTPase activating protein 21 (predicted) 5.19 2.49 Arhgap18* Rho GTPase activating protein 18 (predicted) 5.17 2.24 Ptpre protein tyrosine phosphatase, receptor type, E 5.12 7.43 Trib3 tribbles homolog 3 (Drosophila) 4.89 2.93 Hipk3 homeodomain interacting protein kinase 3 2.84 6.27 Anxa3 annexin A3 2.07 4.19 Transcription, chromatin regulation Zfp469* zinc finger protein 469 (predicted) 26.48 6.75 Anp32a Acidic (Leu-rich) nuclear phosphoprot. 32 family, A 15.68 13.67 Mycn v-myc myelocytomatosis viral related oncogene 8.56 3.23 Rb1 Retinoblastoma 1 6.04 2.51 Hes1 hairy and enhancer of split 1 (Drosophila) 5.76 3.66 Ets1 v-ets erythroblastosis virus E26 oncogene homolog 1 5.12 2.76 Atf3 activating transcription factor 3 5.10 2.37 Nap1l3 nucleosome assembly protein 1-like 3 4.83 2.23 Parp8* poly (ADP-ribose) polymerase family, member 8 4.23 1.99 Fosl1 fos-like antigen 1 3.38 9.47 Tle4 transducin-like enhancer of split 4, E(spl) homolog 2.55 5.04 Cell cycle, apoptosis, DNA repair Gadd45g* growth arrest and DNA-damage-inducible 45 gamma 11.83 3.00 Gadd45b* growth arrest and DNA-damage-inducible 45 beta 7.32 2.71 Gadd45a growth arrest and DNA-damage-inducible 45 alpha 5.70 2.78 Myc myelocytomatosis viral oncogene homolog (avian) 10.46 6.06 Plk2 polo-like kinase 2 (Drosophila) 10.06 11.79 Tpd52l1* tumor protein D53 (mD53) (Tumor protein D52-like 1) 2.12 5.10 Angiogenesis Vegfc vascular endothelial growth factor C 3.36 5.19 F3 coagulation factor 3 1.99 4.11 Immune response Tmem23 transmembrane protein 23 8.12 4.15 Development Inhbb Inhibin beta-B 23.76 3.52 Inha inhibin alpha 9.20 2.55 Nog noggin 8.18 5.11 Bmp2 bone morphogenetic protein 2 7.12 2.29 Bmp4 bone morphogenetic protein 4 7.09 3.97 Id2 Inhibitor of DNA binding 2, dominant neg. HLH protein 6.99 4.88 Kitl kit ligand 5.08 10.57 Proteolysis & peptidolysis Lcn7 lipocalin 7 10.28 5.43 Prss23 protease, serine, 23 6.15 3.12 Gzmc granzyme C 6.04 6.05 Cell adhesion, secreted proteins, ECM 9vs22 GvsS Ctgf connective tissue growth factor 15.3 2.03 Bdnf brain derived neurotrophic factor 8.94 4.01 Pdgfc platelet-derived growth factor, C polypeptide 8.80 2.88 Mdk midkine 8.71 3.38 Daf1 decay accelarating factor 1 7.23 4.97 Tpbg trophoblast glycoprotein 5.90 2.51 Itgav* integrin, alpha V 5.08 2.04 Cyr61 cysteine rich protein 61 4.89 2.60 Pvr poliovirus receptor 4.81 3.54 Hbegf heparin-binding EGF-like growth factor 4.45 3.67 Alcam Activated leukocyte cell adhesion molecule 4.34 2.51 Vasn* similar to Slit-like 2 or vasorin 4.19 3.08 Cytoskeleton Actn1 Actinin, alpha 1 17.52 7.09 Mig12 MID1 interacting G12-like protein 8.02 2.66 Nef3 neurofilament 3, medium 6.77 5.69 Sprr1* Cornifin alpha (Small proline-rich protein 1) (SPRR1) 5.80 7.36 Coro1a coronin, actin binding protein 1A 4.43 3.96 Actn1 actinin, alpha 1 4.39 2.38 Intracellular membranes, trafficking Mal2 mal, T-cell differentiation protein 2 12.08 3.44 Snx7* sorting nexin 7 4.26 2.33 Scrn1 secernin 1 3.01 4.40 Metabolism Akr1c18 aldo-keto reductase family 1, member C18 11.64 2.31 Txnip thioredoxin interacting protein 7.53 3.30 Lpl lipoprotein lipase 6.95 4.13 Prkaa1 protein kinase, AMP-activated, alpha 1 catalytic subunit 4.65 4.21 Gpx1 glutathione peroxidase 1 4.53 2.11 Sms* spermine synthase 4.47 2.63 Qpct* Glutaminyl-peptide cyclotransferase precursor (QC) 4.39 3.84 Rfk* riboflavin kinase 4.18 2.45 Ugcg UDP-glucose ceramide glucosyltransferase 4.18 2.85 Gls glutaminase 3.90 4.84 RNA splicing, translation Rpl13 ribosomal protein L13 5.17 3.74 Rpl37 ribosomal protein L37 4.12 2.90 Receptors, channels, transporters Slc4a4 solute carrier family 4, member 4 13.89 5.37 Edn1 endothelin 1 10.52 3.61 Slc16a6 Solute carrier family 16, member 6 8.98 8.76 Slc6a15 solute carrier family 6, member 15 6.76 5.00 Gnai1 guanine nucleotide binding protein, alpha inhibiting 1 6.71 5.73 Cd7* CD7 antigen 5.40 3.96 Nritp ion transporter protein 4.67 2.38 F2r coagulation factor II (thrombin) receptor 4.52 3.23 P2ry1 purinergic receptor P2Y, G-protein coupled 1 4.48 9.25 Lgr4 G protein-coupled receptor 48 4.30 2.54 Slc7a3 solute carrier family 7, member 3 4.03 6.54
Table S3 : List of the most up-regulated genes in rat Sertoli cells at 9dpp. The 314 probe sets found in the 2-fold selective S9 cluster (shown in figure 2), were classified in 14 molecular and cellular functional groups based on their GO (Gene Ontology) annotation. Shown are 98 genes represented in 172 probes detecting a minimally 4-fold variation in pair wise comparison. 9vs22: mean fold change between Sertoli cells at 9dpp (S9) vs 22 dpp (S22). SvsG: mean fold change between Sertoli cells at 9dpp (S9) vs Spga at 9dpp (G9) (* predicted genes). Cell adhesion, secreted proteins, ECM 9vs22 SvsG Pap pancreatitis-associated protein 32.45 69.55 Thbd thrombomodulin 29.53 6.34 Ncam1 neural cell adhesion molecule 1 19.51 7.81 Cthrc1 collagen triple helix repeat containing 1 18.28 4.06 Boc* boc homolog 17.88 4.75 Cdh11 cadherin 11 10.53 2.99 Pap3 regenerating islet-derived 3 gamma 9.72 82.23 Spp1 secreted phosphoprotein 1 8.70 7.52 Cdh22 cadherin 22 7.53 3.31 Fbn1 fibrillin 1 7.45 2.24 Madcam1 mucosal vascular addressin cell adhesion molecule 1 7.21 3.51 Npy neuropeptide Y 6.67 7.64 Fbn1 fibrillin 1 5.76 2.27 Col4a1* procollagen, type IV, alpha 1 5.65 2.33 Asam adipocyte-specific adhesion molecule 5.39 3.62 Gpc1 glypican 1 4.97 3.79 Col4a2* Procollagen, type IV, alpha 2 4.42 2.04 Sfrp1 secreted frizzled-related protein 1 4.04 3.14 Cxcl13 Small inducible cytokine B13 precursor (CXCL13) 3.69 7.67 Torid LR8 protein 3.33 16.32 Cytoskeleton Tubb2b* similar to tubulin, beta 93.52 3.77 Pdlim3 PDZ and LIM domain 3 12.55 1.97 Mybpc3* myosin binding protein C, cardiac 10.67 2.01 Nes nestin 6.57 2.38 Dbn1 drebrin 1 5.59 2.01 Pdlim2 PDZ and LIM domain 2 4.49 2.72 Trim2* tripartite motif protein 2 4.05 4.40 Tmod1 tropomodulin 1 2.51 28.80 Cell cycle, apoptosis, DNA repair Cdkn2a cyclin-dependent kinase inhibitor 2A 18.44 6.86 Mtsg1 mitochondrial tumor suppressor 1 5.90 2.77 Cdkn2b cyclin-dependent kinase inhibitor 2B 5.20 2.38 Intracellular membranes, trafficking Tmem98* transmembrane protein 98 4.09 2.21 Ech1 enoyl coenzyme A hydratase 1, peroxisomal 2.55 4.31 Metabolism Cox6a2 cytochrome c oxidase, subunit VIa, polypeptide 2 11.51 8.06 Idh2 ADP+-specific isocitrate dehydrogenase 7.89 2.12 Dio3 deiodinase, iodothyronine, type III 7.83 9.22 SelM* selenoprotein SelM 6.30 3.51 Gpx7* glutathione peroxidase 7 5.89 2.40 Mgst2* microsomal glutathione S-transferase 2 4.83 2.87 Crym crystallin, mu 4.81 2.10 Gsta2 glutathione S-transferase Yc2 subunit 4.11 6.41 Cbr3* carbonyl reductase 3 4.05 3.68 Cp ceruloplasmin 3.11 4.03 Ddah2 dimethylarginine dimethylaminohydrolase 2 2.79 4.59 Pygl liver glycogen phosphorylase 1.47 5.09 RNA splicing, translation 9vs22 SvsG Hspb1 heat shock 27kDa protein 1 6.05 2.67 Receptors, channels, transporters Slc15a2 solute carrier family 15, member 2 36.27 3.76 Tacstd2 tumor-associated calcium signal transducer 2 10.35 2.76 Scn3b sodium channel, voltage-gated, type III, beta 9.99 8.99 Kdr kinase insert domain protein receptor 7.95 2.43 Gpr83* G protein-coupled receptor 83 7.92 11.81 Sntg2* syntrophin, gamma 2 7.78 5.04 Slc26a3 solute carrier family 26, member 3 3.18 4.11 Ntrk1 neurotrophic tyrosine kinase, receptor, type 1 2.86 5.08 Scn4b sodium channel, voltage-gated, type IV, beta 2.41 9.27 Trfr2* transferrin receptor 2 2.23 23.77 Smstr28* somatostatin receptor 3 1.54 6.92 Signal transduction Smoc2* SPARC related modular calcium binding 2 31.75 10.26 Arhgef4* Rho guanine nucleotide exchange factor 4 19.05 6.16 S100a5* S100 calcium binding protein A5 11.82 13.24 S100a3 S100 calcium binding protein A3 6.94 4.93 Rerg* RAS-like, estrogen-regulated, growth-inhibitor 5.26 2.73 Rrad Ras-related associated with diabetes 4.44 2.03 Ltbp2 latent transforming growth fact. beta binding prot. 2 4.19 6.19 Cpne8 copine VIII 2.94 5.75 Ptpns1 protein tyrosine phosphatase, non-receptor subst. 1 2.57 6.50 Transcription, chromatin regulation Nupr1 nuclear protein 1 10.67 3.16 Giot1 gonadotropin inducible ovarian transcription factor 1 8.27 8.75 Lmcd1* LIM and cysteine-rich domains 1 6.48 5.15 Nr4a1 nuclear receptor subfamily 4, group A, member 1 4.53 2.61 Rgc32 response gene to complement 32 4.53 3.48 Tead2 TEA domain family member 2 4.09 2.25 Znf704* zinc finger protein 704 2.99 4.29 Znf292 zinc finger protein 292 2.28 4.57 Sox18* SRY-box containing gene 18 1.99 6.58 Angiogenesis Thbd thrombomodulin 4.81 3.04 Development Inhba inhibin beta-A 11.22 2.65 Mgp Matrix Gla protein 5.19 3.48 Bmf Bcl2 modifying factor 4.95 22.91 Neurogenesis & Neuro physiology Gap43 growth associated protein 43 40.50 9.47 Pnoc prepronociceptin 20.72 23.37 Apoe apolipoprotein E 7.84 2.68 Ntf5 neurotrophin 5 5.17 3.97 Penk-rs preproenkephalin, related sequence 4.88 3.89 Dscr1l1 Down syndrome critical region gene 1-like 1 4.27 5.97 Plxnb1* Plexin B1 2.49 6.40 Efna1 ephrin A1 2.02 4.77 Rogdi* rogdi homolog (Drosophila) 1.97 4.46
Suppl. Table 3. (next) Proteolysis & peptidolysis 9vs22 SvsG Adam33* a disintegrin and metalloprotease domain 33 26.41 3.21 Plau Plasminogen activator, urokinase 6.59 2.17 Htra3* toll-associated serine protease 5.37 4.63 Tessp6 testis-specific serine protease-6 5.28 20.61 Plat plasminogen activator, tissue 4.33 2.16 Ube2c* ubiquitin-conjugating enzyme E2C 4.29 3.04 Adam10 a disintegrin and metalloprotease domain 10 4.09 3.42 Plxnc1* plexin C1 1.98 6.21
Table S4 S9 vs S22 G9 vs G22 S9 sel G9 sel transcripts on the data set differential gene display 2-fold S9 selective 2-fold G9 selective array 2-fold S9 vs S22 UP 2-fold G9 vs G22 UP UP UP total in the 9/22 31099 1581 2601 314 445 comparison Almstrup 2004 CIS vs normal 17 4 2 0 2 Almstrup 2005 Multi-type vs normal 27 0 0 0 0 Hoei-Hansen 2004 CIS vs normal 32 7 5 1 1 Korkola 2005 multi-type(non SEM) vs normal 151 17 18 3 7 Korkola 2006 multi-type vs normal (12p) 90 6 11 2 1 Skotheim 2005 multi-type vs normal 298 32 48 7 10 Sperger 2003 (EC) EC up vs normal 638 72 102 13 14 Sperger 2003(SEM) SEM up vs normal 522 39 49 9 7 Yamada 2004 SEM vs normal 40 4 8 0 2 pooled multi-type vs normal 1436 133 204 26 31